-
Previous paper
Performance of marine reserves for fish and associated ecological functions in the Moreton Bay Marine Park
Ben L. Gilby1, Andrew D. Olds1, David Rissik2,3, Christopher J. Henderson1,4, Rod M. Connolly4, Tim Stevens4 and Thomas A. Schlacher1 -
This paper
Changes in fish and crab abundance in response to the Moreton Bay Marine Park rezoning
Michael Haywood1, Richard Pillans1, Russ Babcock1, Emma Lawrence2, Ross Darnell2, Charis Burridge2, Darren Dennis1, Anthea Donovan1, Sue Cheers1, Robert Pendrey1, and Quinton Dell1 -
Next paper
Non-extractive human use and vessel characteristics on Moreton Bay following marine park zoning
Rob Kenyon1, Russ Babcock1, Quinton Dell1, Emma Lawrence2, Christian Moeseneder1 and Mark Tonks1
Changes in fish and crab abundance in response to the Moreton Bay Marine Park rezoning
Authors
Michael Haywood1, Richard Pillans1, Russ Babcock1, Emma Lawrence2, Ross Darnell2, Charis Burridge2, Darren Dennis1, Anthea Donovan1, Sue Cheers1, Robert Pendrey1, and Quinton Dell1Author affiliations
- CSIRO Oceans and Atmosphere, PO Box 2583, Brisbane, Q. 4001;
- CSIRO Data61, PO Box 2583, Brisbane, Q. 4001.
Corresponding author
mick.haywood@csiro.auORCID
Michael Haywood: https://orcid.org/0000-0003-2119-4855
Richard Pillans: https://orcid.org/0000-0001-6234-8764
Russ Babcock: https://orcid.org/0000-0002-7756-1290
Emma Lawrence: https://orcid.org/0000-0001-9018-6010
Ross Darnell: https://orcid.org/0000-0002-7973-6322
Charis Burridge: https://orcid.org/0000-0002-8160-4185
Anthea Donovan: https://orcid.org/0000-0002-5999-6450
Sue Cheers: https://orcid.org/0000-0003-2212-6141
Quinton Dell: https://orcid.org/0000-0001-8421-5700
Book
Changes in fish and crab abundance in response to the Moreton Bay Marine Park rezoning
Chapter
Research Paper Title
Changes in fish and crab abundance in response to the Moreton Bay Marine Park rezoning
Cite this paper as:
Haywood M, Pillans R, Babcock R, Lawrence E, Darnell R, Burridge C, Dennis D, Donovan A, Cheers S, Pendrey R, Dell Q. 2019. Changes in fish and crab abundance in response to the Moreton Bay Marine Park rezoning. In Tibbetts, I.R., Rothlisberg, P.C., Neil, D.T., Homburg, T.A., Brewer, D.T., & Arthington, A.H. (Editors). Moreton Bay Quandamooka & Catchment: Past, present, and future. The Moreton Bay Foundation. Brisbane, Australia. Available from: https://moretonbayfoundation.org/
DOI
10.6084/m9.figshare.8085725
ISBN
978-0-6486690-0-5
Abstract
The 2009 Moreton Bay Marine Park Zoning Plan increased the level of no-take protection from 5 to 16% of the total area of the Moreton Bay Marine Park. Whilst the primary motivation for increased protection was the conservation of the various representative habitats within the Marine Park, another expected outcome of restricting fishing activities was to increase the abundance and biomass of target species. In order to determine whether there had been any changes in the abundance and biomass of targeted species within the areas closed to fishing, we examined the catch rates, size structure and sex ratios of mud and sand crabs and catch rates and biomass of a number of species of selected line-caught fish species at seven Marine National Park Zones (MNPZ; no-take) within the inshore areas of the Marine Park. We also used Baited Remote Underwater Video (BRUV) to examine the relative abundance and biomass of fish at three MNPZs in the offshore area of the Marine Park. Survey sites were located within the newly established no-take zones (hereafter termed New green zones), nearby areas open to fishing and in areas that had been closed to fishing since 1997 (hereafter termed Old green zones). Catch rates and the size of mud crabs and yellowfin bream were higher within the two Old green zones compared to the New green zones or Open areas. However, sand crabs did not show any significant responses to zoning in any of the MNPZs surveyed. Catch rates and mean weight of snapper increased rapidly in the New green zone at St Helena Island. In the offshore areas of the marine park, the average biomass of the fishing target species: snapper, spangled emperor, redthroat emperor, blackspot tuskfish, Maori rock cod and goldspot wrasse, all increased in the New green zones. In contrast, there was no significant change in the abundance of targeted aquarium species. Overall, there was evidence of a trend towards increased numbers and biomass of some targeted species within the New green zones within three years of their implementation. However, this is insufficient time to determine the full impacts of the zoning changes, particularly for long-lived species and further regular monitoring is required to make a comprehensive assessment.
Keywords: fish, crab, BRUV, Marine Protected Area, no-take marine reserve, fishing
Introduction
No-take marine reserves or Marine Protected Areas (MPAs) have long been used by management agencies to conserve biodiversity, habitats and increase the biomass of fishery targeted species (1, 2). Provided MPAs are designed and managed appropriately (3) they have been demonstrated to be effective in increasing the biomass and abundance of target species and may also impact other taxa indirectly through trophic cascades (4). They are also considered an important tool for ecosystem-based management to assist in mitigating threats to marine ecosystems (5).
The original Moreton Bay Marine Park (MBMP) was established in 1997 (6) and covered an area of approximately 3400 km2 and extended from between 3 to 20 km offshore to a maximum depth of about 150 m (7). The park was classified into five zones in order to manage the activities within the park. In order of ascending level of protection, they were: general use, habitat, conservation, buffer and protection. The highest level of protection was afforded by the protection zones whose purpose was: “…to provide for the permanent preservation of the zone’s biological diversity and natural condition to the greatest possible extent, while allowing the public to appreciate and enjoy the undisturbed nature of the zone” (6). In effect this meant the protection zones were classified as no-take zones. The area of the marine park classified as protection zone under the 1997 Zoning Plan was approximately 0.5% of the total area of the Marine Park. This constituted the lowest level of protection of any Queensland marine park and was not considered adequate to satisfy contemporary standards of protection for marine conservation.
The Queensland Department of Environment and Science (known at the time as the Queensland Environmental Protection Agency) conducted a broad-scale benthic mapping program that identified 16 broad habitats within the Moreton Bay Marine Park. The habitats ranged from shallow, turbid, mud-bottom estuarine waters to deep, clear-water reef environments. Following a review of the 1997 MBMP zoning plan in 2007, it was recommended that a minimum of 10% of the area of each of the 16 major habitat types (7) identified within the MBMP were to be classified as no-take zones. These recommendations were implemented in the 2009 Marine Park Zoning Plan with 16% of the marine park being classified as Marine National Park Zones (MNPZ; no-take) (Table 1, Fig. 1).
Table 1. Areas of the Moreton Bay Marine Park sampled during this study. Codes, names and areas of the Marine National Park (MNP) zones are as declared by the Queensland Environmental Protection Agency (EPA) in 2008. N.B. the EPA is now known as the Queensland Department of Environment and Heritage (DEH).
| Code | Name | Area (ha) | Sampling Method |
| MNP02 | Tripcony Bight-Long Island | 1151.9 | Crab pots & line fishing |
| MNP04 | Flinders Reef | 75.9 | BRUV |
| MNP09 | Deception Bay | 1674.2 | Crab pots & line fishing |
| MNP10 | Cherubs Cave-Henderson Rock | 2984.0 | BRUV |
| MNP17 | St Helena Island | 903.6 | Crab pots & line fishing |
| MNP19 | Flat Rock | 448.4 | BRUV |
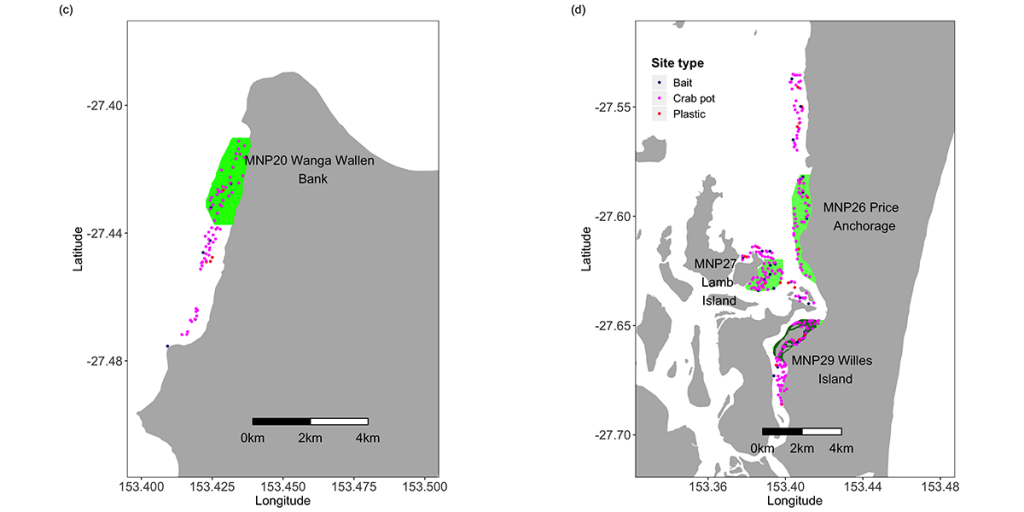
| MNP20 | Wanga Wallen Bank | 360.9 | Crab pots & line fishing |
| MNP26 | Price Anchorage | 374.0 | Crab pots & line fishing |
| MNP27 | Lamb Island | 198.9 | Crab pots & line fishing |
| MNP29 | Willes Island | 209.9 | Crab pots & line fishing |
No-take zones are seen as fulfilling many objectives. Among these are the conservation of biodiversity, protection of habitats and conservation of fish stocks. In order to test whether the increased level of protection from fishing within the MBMP had an influence on fish and crustacean populations, CSIRO and the Queensland Department of Environment and Science conducted a study to compare the abundance of fish and sand and mud crabs in on similar habitats both inside and outside ten of the MNPZs comprising a range of habitats throughout the Marine Park.
Methods
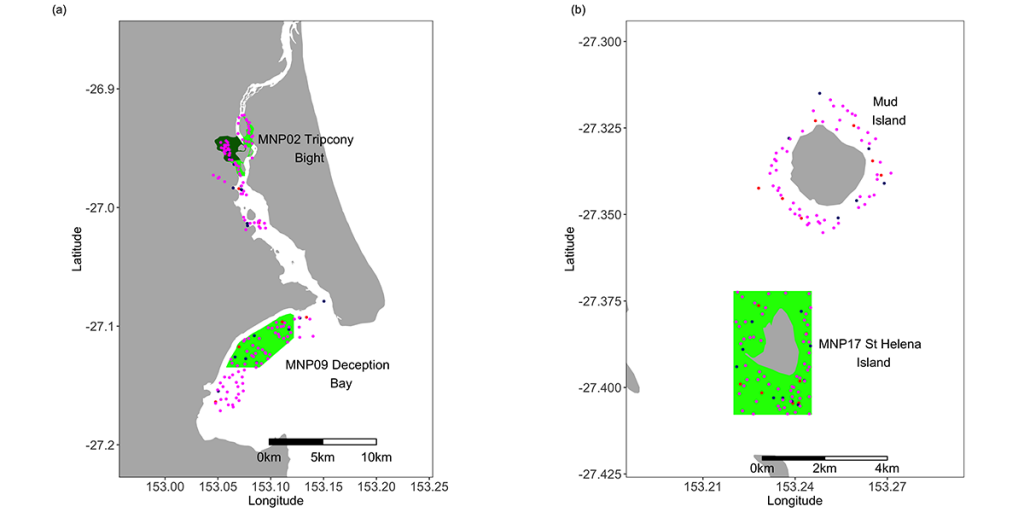
In order to assess the impacts of the zoning plan on fish and crabs, a series of sampling sites were selected on similar habitat types, both inside some of the original Old green zones (established in 1997), in the New green zones (established in 2009) and in areas open to fishing (hereafter referred to as ‘Open’ areas) (Figs 1, 7). Site selection was performed using an approach known as Generalised Random Tessellation Stratified Sampling (GRTS; (8) The GRTS method selects sites from a spatially referenced sampling frame in a manner that achieves spatial balance with randomness but less clustering than conventional random sampling. The relative probability of selection in different parts of the sampling frame can be varied according to a pre-defined weighting scheme. In our case, sites for line fishing and BRUV close to or on reef were allocated 5 times the weight of non-reef sites, since sandy, non-reefal areas have a much lower abundance of fish compared to areas on reef. Sampling was conducted twice annually (winter [June to August] and summer [December to February]) to incorporate seasonal variation in abundance, biomass and composition of the fish and crustacean assemblages.
The new zoning came into effect in December 2008, however any responses to the zoning would not be detectable until sometime after that. Data collected during the first two sampling sessions (Winter 2008 and Summer 2009) provided the baseline “Before” data against which subsequent data, collected after the new zoning plan was implemented, were compared (see below for statistical methodology). Bi-annual sampling continued for two years after the new zoning was implemented (Winter 2009 to Winter 2011). The same sites were sampled each season. The range of environments and species found throughout the MBMP required that a variety of techniques be employed in order to sample them effectively. We used potting for crabs within Moreton Bay (9), line-fishing (bait and lure) for fin fish within turbid estuarine and inshore waters, and stereo BRUV (10) for fish in the clear waters outside the Bay.
Crab potting
Crab pots were of similar design to those used in the commercial fishing industry being made of dark green trawl mesh (outer walls and entrances) with four entrances and 900 mm diameter and 300 mm in height (0.11 m3). Floats with identification and permit number were attached to all pots. Pots were deployed and recovered with the assistance of the Queensland EPA vessel “Spoonbill” and her crew. In instances where the water was too shallow, pots were deployed using the 5 m CSIRO Naiad. Pots were baited with a whole mullet (Mugil cephalis) and a single pot was deployed at each site. Pots were set in the same location each season throughout the study period with the aid of a GPS. Pots were generally deployed during high tide in the day, and checked the following day with set and check times recorded. All crabs, fish and elasmobranchs captured in the crab pots were identified, measured, sexed and released alive at the site of capture. Female crabs were also checked for eggs and missing legs and chelae were recorded for all crabs.
Bait fishing
To standardise bait fishing CPUE estimates, all fishing was done with 1/0 circle hooks baited with prawn (Penaeidae). The rig consisted of a 1/0 circle hook attached to a small swivel with 6 kg monofilament fishing line. The swivel was attached to the main fishing line and a small sinker placed above the swivel. Sinker size was determined by water depth and current. Each bait fishing event was done at anchor in a pre-defined location and lasted 30 min. Sites were located accurately using portable GPS units. During the 30 min sampling period, all captured fish were placed into an aerated tub of water from the site of capture. At the end of the 30 min period, all fish were identified, measured and weighed. Bait fishing was generally undertaken to target yellowfin bream, snapper and whiting.
Lure fishing
Fishing with soft plastic lures was carried out during 30 minute intervals while the boat was drifting with wind or tide. The position at the start and end of the 30 min period was recorded. Fishing with soft plastic lures involves repeatedly casting a small lure in front of the drifting boat. The lure is allowed to sink to the bottom and is then erratically retrieved to imitate a small fish. This method is commonly employed by recreational fishers in South East Queensland. Any captured fish were treated the same as those captured by bait fishing with individual catch rates of the two anglers also recorded. Lure fishing was done on the same days as bait fishing and lures were used to target dusky flathead and snapper. All fish were identified, measured and weighed.
Baited Remote Underwater Video (BRUV)
We used stereo Baited Remote Underwater Video (BRUV) units supplied by SeaGIS Pty. Ltd (11). These systems consist of a pair of digital video cameras (Panasonic NV-GS330) with 0.5´ wide-angle lenses in waterproof PVC housings mounted on a galvanised steel frame. The frames were fitted with breakaway legs in the event of fouling on the seabed and were able to be loaded with a variable amount of ballast if required under high current conditions. A rotating flashing diode mounted on a pole such that it was visible from both cameras facilitated synchronisation of the two stereo images during video analysis. A bait bag (220 ´ 150 mm; 10 mm mesh size) made from plastic gutter guard was mounted on a PVC conduit pole and fixed approximately 1.2 m in front of the cameras.
Prior to deployment each video camera was loaded with a new mini DV tape and the bait bag was filled with pilchards (approximately 750 g). The pilchards were crushed in order to maximise dispersal of the fish oil and flesh. Once the skipper had positioned the vessel on site, the BRUV was deployed from the stern. Each BRUV had a surface buoy attached with 8 mm rope to facilitate recovery. BRUVs were deployed for 45 min as previous research in Western Australia has demonstrated that a deployment time of at least 36 min is necessary to record the majority of the fish species (12). Once the BRUVs were recovered, tapes were replaced, batteries checked and bait replaced before the subsequent deployment. Using four BRUV units generally permitted us to conduct between 20 and 25 deployments each day. Adjacent replicate sites were usually separated by a minimum of 250 m to avoid the possibility of the same fish visiting adjacent BRUVs during the sampling period. In some cases, due to a paucity of the appropriate habitat, it was necessary to locate sites ~ 100 m apart; in these cases the deployments were not done on the same day.
Stereo video analysis
The video tapes were digitised to 720 PAL 16:9 interlaced and converted to .avi format (using the Xvid codec) at the Cleveland laboratory using Adobe Premiere Elements. Video analysis was conducted in two stages. Initially one of the stereo pair of videos was analysed for species composition and abundance using EventMeasure software (SeaGIS Pty. Ltd., (11)). Fish species identification was confirmed using a number of texts: (13-19) and websites (e.g. FishBase (20)). To avoid counting the same fish more than once as they move into and out of the camera’s field of view, we recorded relative abundance counts of each species of fish as the maximum number of individuals of each species sighted at any one time during the video deployment; this statistic is termed MaxN (21).
Following the identification and enumeration of fish, the file output from Event Measure was loaded into a second software package: PhotoMeasure (SeaGIS Pty. Ltd.(11)) in order to measure the fish. This software utilises imagery from both the left and right cameras of the stereo pair to make accurate measurements of fish length. The accuracy and precision of these measurements is reliant on the calibration of the stereo cameras and so we calibrated each stereo pair both before and immediately following each sampling season using Cal software (SeaGIS Pty. Ltd. (11)). A second calibration was necessary each season in case the cameras were jarred out of alignment during deployment or recovery.
The Photo Measure software gave an estimate of the precision of each length measurement as they were being made permitting the operator to discard the measurement if the precision was >5% of the length estimate. The operator was then able to scroll forward or backwards within the video to locate a clearer image and try again. The software also recorded the distance of each measured fish from the camera system (range). We used highest value of the range for each BRUV deployment as an index of the visibility for each deployment; this was then added as a covariate to the statistical models described later. Fish lengths were converted to weights using published allometric relationships of the form W = a ´ FLb (, where W = weight (g), a and b are estimated coefficients and FL is the Fork Length (mm) (20).
Data analysis
The analysis of the BRUV and line-caught fish presented a problem as the data contained a large percentage of zeros. We used zero-inflated models to accommodate this problem. Zero inflated models are two component mixture models combining a point mass at zero with a count distribution that we define here to be a negative binomial. Due to the sparsity of data, only a linear trend term was fitted to the zero-inflation component. The zero inflation component accounts for any trend in the number of sites each species was caught at across the five sampling seasons. The crab pot data did not suffer the zero-inflation problem and so were analysed using the generalised linear model function of the MASS library of the R programming environment (22, 23).
Our initial hypothesis was that, all other factors being equal, if the New green zones were acting to protect targeted species populations, then the trend in their abundance and biomass would increase following the establishment of the 2009 zoning plan whereas the trends for abundances in the Open areas and Old green zones would not change. Given this, the model terms we were interested in were: status (Old green zone, New green zone and Open area) and linear trend within each of the Old green zones, New green zones and Open areas.
In Queensland, recreational and commercial fisheries are managed by size limits (fish and crabs), bag limits (recreation fish and crabs) and male-only take of mud and sand crabs (24)
Minimum size and any sex related regulations for key recreational and commercial target species are shown in Table 2. There are no bag limits for commercial fisheries. Lengths are in carapace width (CW) for crabs and total length (TL) for line-caught fish.
Table 2. Minimum and maximum size limits and sex-specific regulations for selected target species in Queensland.
| Species | Minimum size | Max size | Sex specific regulations |
| Sand Crab | 11.5 cm CW | n/a | Male only |
| Mud Crab | 15 cm CW | n/a | Male only |
| Bream | 25 cm TL | n/a | n/a |
| Snapper | 35 cm TL | 1 fish over 70 cm TL | n/a |
| Dusky Flathead | 40 cm TL | 75 cm TL | n/a |
| Blackspot Tuskfish | 30 cm TL | n/a | n/a |
| Venus Tuskfish | 30 cm TL | n/a | n/a |
| Maori Rockcod | 45 cm TL | n/a | n/a |
| Redthroat Emperor | 38 cm TL | n/a | n/a |
Results and Discussion
Inshore Fish and Crabs
A total of 3522 crab pots were set at 671 sites during this study of inshore areas of Moreton Bay. During the study we captured 1777 mud crabs and 1507 sand crabs that were measured and sexed and released. We surveyed 136 line-fishing sites that were sampled 539 times during the study (approximately 4 times per site), with over 1570 fish comprising 53 species being captured, measured and released (Table 3). The most commonly caught fish were yellowfin bream (Acanthopagrus australis) and snapper (Pagrus auratus) (Table 3).
Table 3. Number of fish representing each species caught at bait sites, including the cumulative number of sites over three years of the study. Species are listed in descending order of abundance.
| Species | Number of fish | Number of sites |
| Acanthopagrus australis | 447 | 192 |
| Pagrus auratus | 328 | 118 |
| Rhabdosargus sarba | 72 | 48 |
| Lethrinus genivittatus | 46 | 18 |
| Sillago maculata | 40 | 31 |
| Neoarius graeffei | 36 | 19 |
| Lethrinus laticaudis | 29 | 19 |
| Choerodon cephalotes | 22 | 16 |
| Dasyatis fluviorum | 21 | 19 |
| Platycephalus fuscus | 18 | 16 |
| Pomadasys kakaan | 18 | 12 |
| Pentapodus paradiseus | 13 | 6 |
| Tragulichthys jaculiferus | 12 | 10 |
| Aptychotrema rostrata | 11 | 11 |
| Sillago ciliata | 11 | 10 |
| Pseudolabrus guentheri | 9 | 7 |
| Terapon jarbua | 9 | 8 |
| Pelates quadralineatus | 8 | 8 |
| Dicotylichthys punctulatus | 6 | 4 |
| Euristhmus lepturus | 5 | 3 |
| Lagocephalus sceleratus | 5 | 5 |
| Sillago analis | 5 | 4 |
| Himantura astra | 4 | 4 |
| Platycephalus indicus | 4 | 2 |
| Polydactylus sp – small | 4 | 4 |
| Halichoeres margaritaceus | 3 | 3 |
| Lutjanus russelli | 3 | 3 |
| Polydactylus multiradiatus | 3 | 3 |
| Gnathonodon speciosus | 2 | 2 |
| Himantura toshi | 2 | 2 |
| Lutjanus argentimaculatus | 2 | 1 |
| Neotrygon kuhlii | 2 | 2 |
| Parapercis nebulosa | 2 | 2 |
| Pseudorhombus jenynsii | 2 | 2 |
| Rhizoprionodon acutus | 2 | 2 |
| Saurida undosquamis | 2 | 2 |
| Tripodichthys angustifrons | 2 | 2 |
| Tylosurus crocodilus | 2 | 2 |
| Acentrogobius gracilis | 1 | 1 |
| Argyrosomus japonicus | 1 | 1 |
| Chelinus trilobatus | 1 | 1 |
| Diagramma pictum | 1 | 1 |
| Epinephalus coioides | 1 | 1 |
| Hemigaleus australiensis | 1 | 1 |
| Himantura fluviourum | 1 | 1 |
| Monacanthus chinensis | 1 | 1 |
| Platycephalus endrachtensis | 1 | 1 |
| Pomatomus saltatrix | 1 | 1 |
| Portunus armatus | 1 | 1 |
| Rhinobatus typus | 1 | 1 |
| Rhizoprionodon taylori | 1 | 1 |
| Sphyraena obtusata | 1 | 1 |
| Upeneus tragula | 1 | 1 |
Old green zones
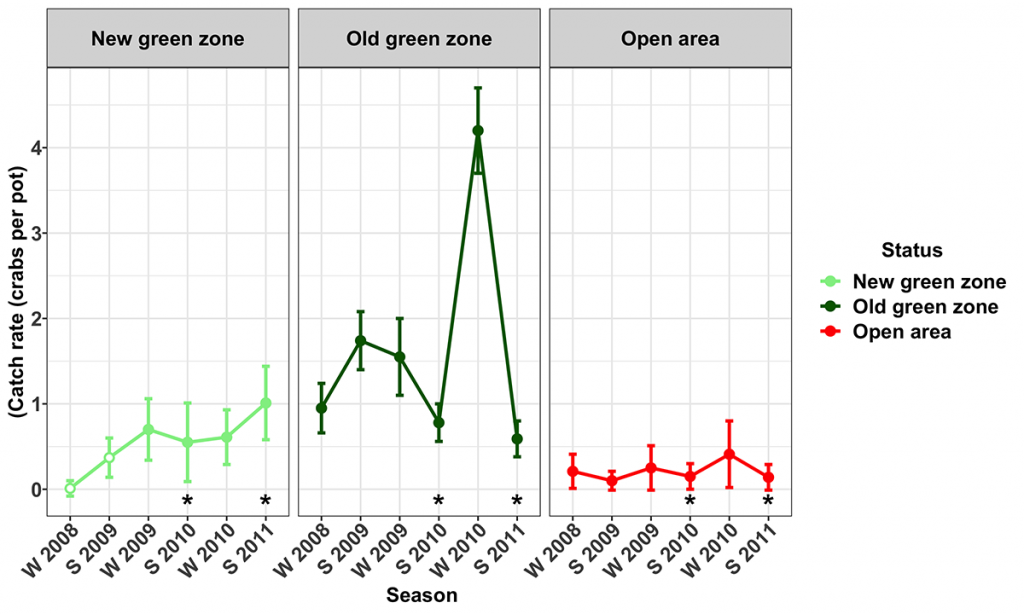
As part of the 2009 Marine Park Management Plan the Old green zones at Tripcony Bight (MNP02) and Willes Island (MNP29) were increased in area by 47 and 85% respectively. Catch rates of legal-sized male mud crabs (Queensland Fisheries regulations protect all female mud crabs) in these Old green zones were 4–18 times greater than the catch rates in the adjacent Open areas. However, they did vary over time with factors such as the season and the impact of the floods in January 2011. At Tripcony Bight, catch rates of legal-sized male mud crabs in the Old green zone were 1.6–9 times greater than the New green zone except in the summers of 2010 and 2011 when catches were not significantly different as they were influenced by floods (Fig. 2).
The sex ratio of mud crabs in the two Old green zones (Tripcony Bight and Willes Island) was heavily skewed towards males (5 – 18 times greater than adjacent Open areas). In contrast, in the Open areas and New green zones, the sex ratio was dominated by females. The markedly different sex ratio in the Old Green zones suggests that no take zones protect the mud crab population within these zones from male only harvesting, thereby allowing the mud crab sex ratio to return to unfished levels where males dominate in almost all size classes. The implications for long term sustainability of crabs in sex biased fisheries and the potential for sperm limitation are currently unknown. However insufficient sperm supply from males due to the smaller average size of males, reduced number of males and female-biased sex ratio are capable of leading to a reduction in the reproductive success of female crustaceans in several studies (25-28).

Yellowfin bream (Acanthopagrus australis) catch rates in the Old green zone at Tripcony Bight were highly variable but up to seven times greater than in the Open areas (Fig. 3). Similarly, biomass of yellowfin bream was up to 2.5 times greater in the Old green zone than in the Open area, but it was also highly variable. Within the New green zone at Tripcony Bight, catch rates of bream in the New green zone trended strongly upwards over the period of the study (Fig. 3).

On average, catch rates of dusky flathead (Platycephalus fuscus) were highest in the Old green zone at Tripcony Bight. Within the Old green zone, they were consistently highest in winter. However, there was no seasonal pattern in the Open areas. In winter surveys the catch rates of flathead were up to 20 times higher in the Old green zone. However, in summer, 2010 catch rates in the two areas were similar (Fig. 4). Catches of legal-sized flathead were considerably higher within the Old green zone (78% of fish ³ legal size) compared to the Open area (58% of fish ³ legal size).

New green zones
Significant increases in the catch rates of mud crabs were only detected in two of the five surveyed newly established green zones (MNP02 and MNP26) during the course of the study. Catch rates of legal-sized male mud crabs at Tripcony Bight (MNP02) increased steadily over time in the New green zone and were 2–6 times greater than catch rates in the Open areas.
In the winter of 2008 when sampling began, mud crab catch rates at the Price Anchorage New green zone (MNP26) were very low and similar to those obtained at the adjacent Open area. During the period of the study, catch rates within the Open area remained relatively unchanged, whereas those from the New green zone steadily increased to be approximately four times greater than those within the Open area (Fig. 5). Concurrent with this increase, there was a significant decrease in the catch rate of sand crabs, the only significant MNPZ effect measured for sand crabs. Lower sand crab catches may have been the result of increasing competition with mud crabs resulting in fewer sand crabs entering the pots.
There was no change in the sex ratio of mud crabs in the New green zones at MNP02, MNP26 or MNP27 following the rezoning. There was however, an increase in the proportion of males at MNP09, although there was no change in the proportion of legal-sized males. In contrast, at Price Anchorage (MNP26), although there was no change in the overall sex ratio, the proportion of legal-sized males increased over the period of the study.
The average size of females in the New green zones and Open areas were similar and there were no temporal trends. Similarly, there were no consistent changes in the average size of males in the New green zones at MNP02, MNP09 and MNP27. However, at MNP26 the average size of males in the New green zones increased significantly and was equal to or greater than minimum legal size in all surveys after rezoning. The lack of response in the size of males or catch rates of legal-sized male mud crabs in the New green zones at MNP09, MNP17, MNP20 or MNP27 is likely due to habitat at these sites as they predominantly consist of sand, rubble and in the case of MNP17, rocky reef. These areas are unlikely to ever support large numbers of mud crabs and future sampling at these sites will probably not detect any changes. The fact that the highest rates of illegal fishing recorded within the Moreton Bay Marine Park were at the New green zone at Lamb Island (MNP27; (29) may also explain the lack of response of legal-sized male mud crabs

In the New green zone at St Helena Island (MNP17) snapper (Pagrus auratus) responded strongly. Catch rates of snapper on soft plastic lures prior to rezoning were similar in the New green zone and Open areas. However, after rezoning the catch rates in the New green zone were approximately 10 times greater than Open areas. Because of the seasonality of snapper movements in Moreton Bay this trend was most pronounced in winter (Fig. 6).
There was a significant increase in the mean weight of snapper in the New green zone, with approximately an 18% weight increase per annum. Mean weight of snapper in the Open area increased by approximately 1% per annum and was not statistically significant. The number of legal-sized snapper captured in the New green zone was approximately seven times greater than the Open area with most legal-sized fish captured 12–18 months after rezoning.
At St Helena there was no response observed in catch rates of other fish, mud crabs or sand crabs. The size of male sand crabs increased significantly in the New green zones at St Helena (MNP17) and Price Anchorage (MNP26). However, the reasons for this increase are uncertain given there was no trend. Sand crab numbers did not show any direct positive response to zoning at any of the MNPZs surveyed, potentially because of the high rates of movement in this species.

Offshore Fish
Three of the offshore rocky reefs within the marine park were chosen for this study: Flinders Reef, Henderson Rock and Flat Rock. Flinders Reef had the only Old green zone in the offshore region of the marine park. However, grey nurse shark protection zones had been established around Henderson Rock and Flat Rock since December 2003. Since bottom fishing had been banned in these areas since that time, we chose to classify them as Old green zones for the purpose of this study. The BRUVs were deployed at 175 sites inside the Old and New green zones, and at similar surrounding areas where fishing was permitted (Open areas), at Flinders Reef (MNP04), Henderson Rock (MNP10) and Flat Rock (MNP19) twice yearly during winter and summer from 2008 to 2010 (Fig. 7). A total of 63,654 fish comprising 442 species and 77 families, and 52 turtles were identified from 605 hours of BRUV footage taken as part of this study.
At the time this study was conducted, the New green zones had only been in place for approximately two years. Nevertheless, the study found encouraging results for several fish species targeted by anglers, including an increase in the average biomass of snapper, spangled emperor, redthroat emperor, blackspot tuskfish, Maori rock cod and goldspot wrasse in the New green zones, in the offshore areas of the MBMP
While these results are encouraging, it should be noted the changes to the marine park are still new and many of these species are long-lived (e.g. Snapper and Spangled Emperor live for up to approximately 30 years). Therefore the responses of populations within the New green zones may take many years to become fully evident. Any responses will also vary among species depending on their range of movement, as well as the size and the types of habitat that are prevalent within each green zone.
It should also be noted that although the numbers of people fishing in green zones has declined, fishing has not stopped completely (Kenyon et al, this volume (30)). A companion study measuring the influence of the 2009 zoning plan on human use, showed that fishing activity in green zones declined by a little over half, from 6.3 to 2.6% of the observed fishing activity. Although low, this activity has the potential to reduce or nullify any positive results within green zones (3).
Snapper (Pagrus auratus)
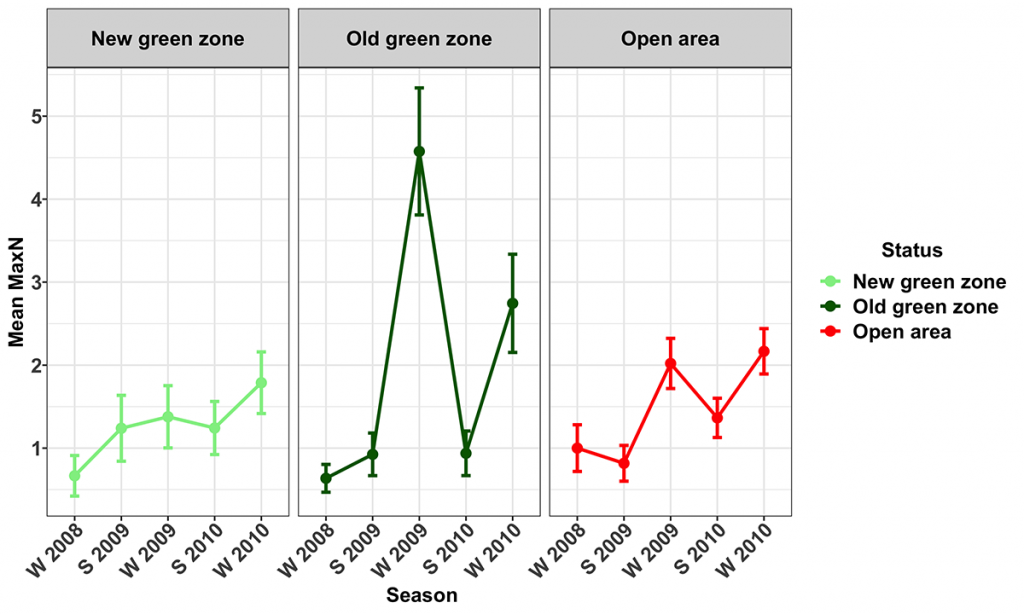
Snapper were present at all of the surveyed MNPs and their corresponding Open areas. Their numbers varied seasonally, with more snapper being recorded during the winter surveys. The trend term in the model was marginally significant (p=0.059), indicating the numbers of snapper (Figs 8, 9) increased during the study in the Open (14.8 ± 14.8 [mean ± 95% CI] % per season) and Old green (19.7 ± 17.5 % per season) zones, but not in the New green zones. The average biomass of snapper increased during the study period across all zones (Fig. 10). However, the increase was only significant in the New green zones, where on average, biomass increased by 13.6 ± 12.5% per season suggesting that whilst the number of Snapper remained stable within the New green zones, they increased in size.


Spangled Emperor (Lethrinus nebulosus)
Numbers of spangled emperor were generally low throughout the study area. The highest numbers were found on rugose areas around Flinders Reef (MNP04). The trend term in the model indicated an overall decrease in the abundance of spangled emperor over the course of the study. However, further investigation revealed that this was driven by an estimated decrease of 83 ± 82.5 % per season in the Old green zones, with no detectable change in numbers in the other zones (Fig. 11).
The mean biomass of spangled emperor in the New green zones increased significantly during the study (33.9 ± 34.0%) whilst there was no significant trend in biomass in either the Old green zones or the Open areas. This suggests that the protection from fishing provided by the New green zones was effective in allowing spangled emperor within these zones to increase in size through the period of the study.
Redthroat Emperor (Lethrinus miniatus)
Redthroat emperor were observed throughout the study area, but they were consistently more abundant within the Old green zone at Henderson Rock (MNP10). This is unlikely to be due to habitat preference alone since both the New green zones and Open areas at MNP10 had similar habitat to that within the Old green zone and so the difference is likely to be due to lower fishing pressure in the Old green zone.
There was a significant decrease in the relative abundance of redthroat emperor in both the Open (36.1 ± 17.0%) and Old green (15.7 ± 12.5%) zones and no change in the relative abundance in the New green zones. The mean biomass of redthroat emperor increased significantly in all zones over the period of the study, with the greatest increase occurring in the New green zones (Open: 18.0 ± 12.5% per season; New green: 33.0 ± 17.0% per season; Old green: 17.9 ± 10.0% per season). This was despite a decrease in relative abundance suggesting that although numbers decreased the size of the remaining fish increased in all zones.
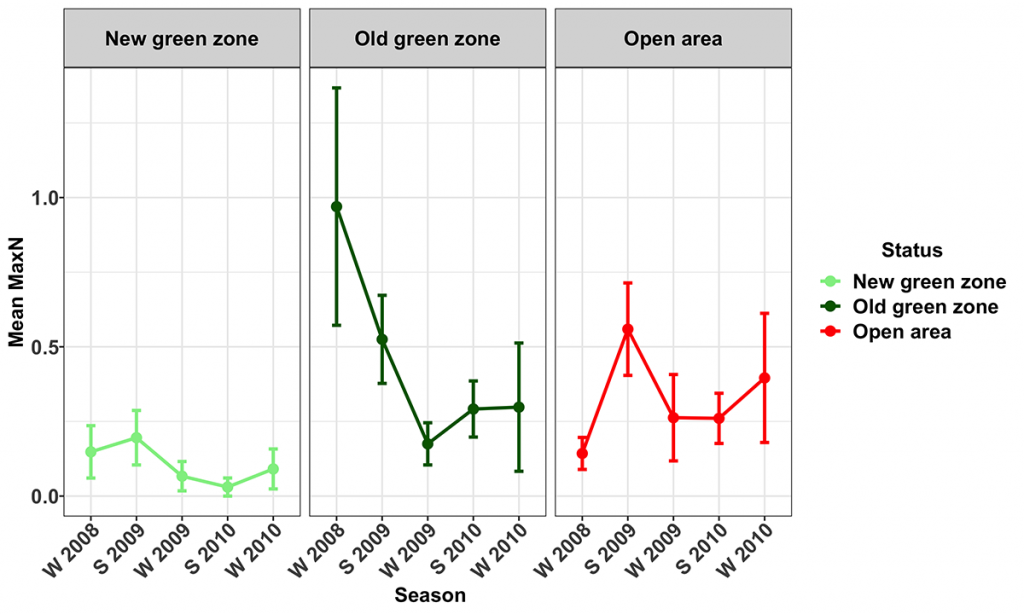
Venus Tuskfish (Choerodon venustus)
Venus tuskfish were observed almost exclusively at Flat Rock (MNP19) and were rarely recorded at either Flinders Reef (MNP04) or Henderson Rock (MNP10). The relative abundance of venus tuskfish increased significantly in the New green zone at Flat Rock (41.1 ± 28.5% per season), whereas there was no change in their abundance in either the Old green or Open areas (Fig. 12). The mean biomass of venus tuskfish decreased by an average of 23.5 ± 21.5 % per season only in the New green zones throughout the study period. This indicates that the New green zone at Flat Rock may be protecting venus tuskfish through enhanced survival of new recruits but perhaps not through higher survival of older fish.

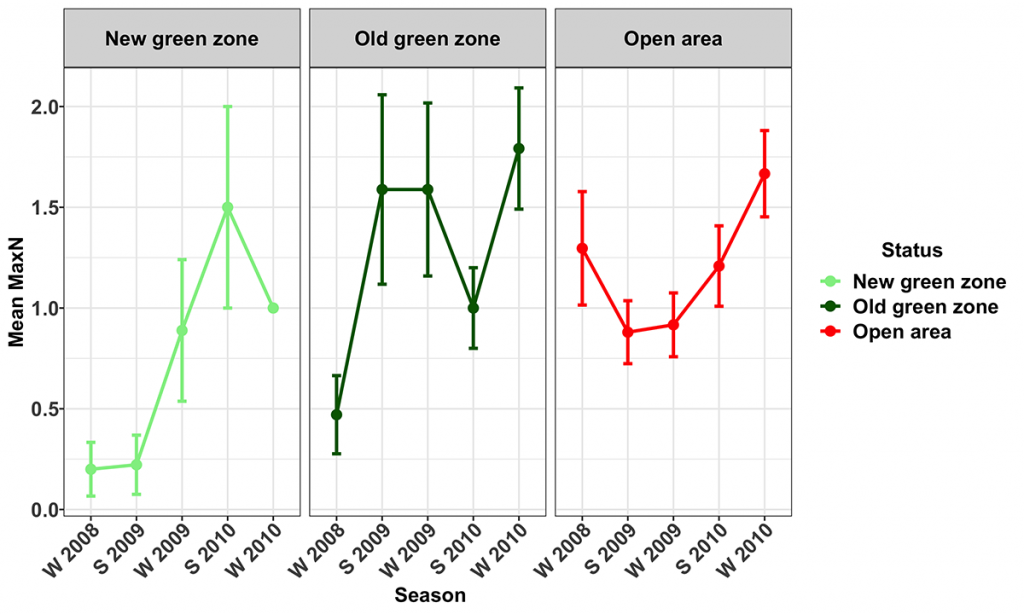
Blackspot Tuskfish (Choerodon schoenleinii)
The relative abundance of blackspot tuskfish was highest at Flat Rock (MNP19) compared to either Henderson Rock (MNP10) or Flinders Reef (MNP04). Mean relative abundance of blackspot tuskfish increased significantly over the period of the study in the New green (42.8 ± 42.5% per season) and Open zones (19.6 ± 20.5 % per season) with no statistically significant change within the Old green zones (Fig. 13). Mean biomass of blackspot tuskfish increased over the period of the study in the New green zones (44. 1 ± 44.0 % per season) with no statistically significant change in mean biomass detected in either the Open areas or Old green zones, suggesting that the New green zones are beginning to protect the existing populations of blackspot tuskfish through enhanced survival.
Maori Rock Cod (Epinephelus undulatostriatus)
Maori rock cod were most common at the New green and Open zones in the region around Henderson Rock (MNP10) and were rarely observed at either Flinders Reef (MNP04) or Flat Rock (MNP19). The trend term in the model for relative abundance was not significant indicating there was no change in abundance of maori rock cod since the introduction of the 2009 Moreton Bay Marine Park Zoning Plan. There was however, a significant increase in the mean biomass of maori rock cod in the Open and New green Zones over the period of the study (by 28.9 ± 34.5% and 30.6 ± 42.0% respectively). This result is difficult to interpret given there was no increase in biomass in the Old green zones, but a significant increase in both the New green zones and Open areas. It may suggest a reduction in overall fishing pressure on this species.
Goldspot Wrasse (Bodianus perditio)
Goldspot wrasse were consistently most abundant in the Old green zones at Henderson Rock (MNP10). The trend term for the model of relative abundance of goldspot wrasse was not significant indicating no change in relative abundance over the study period. There was however, a statistically significant increase in mean biomass in the Open (14.8 ± 13.5%) and marginally statistically significant increase in the New green (22.0 ± 22.0%) zones throughout the period of the study. Similar to the result for Maori rock cod, this is difficult to interpret, except to suggest that there may be low and variable fishing pressure on this species.
Aquarium target species
Six species of fish targeted by the aquarium fish industry were observed on the BRUVs in sufficient numbers for analysis: pencil surgeonfish (Acanthurus dussumieri); keyhole angelfish (Centropyge tibicen); Guenther’s butterflyfish (Chaetodon guentheri); neon damselfish (Pomacentrus coelestis); moon wrasse (Thalassoma lunare); and green moon wrasse (Thalassoma lutescens). However, there was no significant change in the relative abundance of any of these species during the study. We did not expect to detect significant changes in the relative abundance of fish targeted by the aquarium fish industry since the levels of collection pressure have historically been relatively low (50 to 200 days effort in the region in 2003; (31)), however we collected the data to provide a robust baseline for future monitoring.
Conclusions
The MNPZs in the offshore reef areas of Moreton Bay Marine Park were beginning to impact populations of fish and crabs within two years of their establishment. During these early stages, the changes were primarily through the increased biomass of most targeted fish species in the offshore region of the park. Increases in relative abundance would only be evident in fish following several years of protection from fishing. In contrast, both catch rates and average size of the shorter-lived mud crabs and the average size of sand crabs increased in several of the New green zones, indicating they are effective for these species where there is appropriate habitat available. In the inshore New green zone at St Helena, snapper responded strongly with increases in both catch rates and mean weight recorded. However, it is important to continue monitoring key green zones in order to understand their long-term effectiveness and to detect any unforeseen changes that may arise from the greater level of protection afforded to MNPZs in Moreton Bay. Furthermore, the full value of these no-take zones as benchmarks for ongoing evidence-based management of the broader marine park can only be realised by regular monitoring and assessment, as per the water quality monitoring programs in Moreton Bay, for example. Maintaining such a program will present significant challenges.
Presently, the full potential of these areas for conserving fish populations has not been realised due to two principal factors: time since establishment and non-compliance by some Bay users with no-take regulations.
More time is required for the full potential effects of New green zones to be achieved. This is a fundamental consequence of many fish species’ biology. For example, many targeted fish species are relatively long-lived (e.g. spangled emperor: 14 (32) to 28 (33) years) and in the case of protogynous hermaphrodites such as the spangled emperor, may not mature as females until 6 years of age (34). Consequently, significant changes in relative abundance would not be expected within 3 years. Repeat surveys over the coming years are required in order to evaluate the rates of change and variability in fish populations as well as the size of any effect.
Although the level of non-compliance quantified in both Old green and New green zones has declined since the implementation of the 2009 Moreton Bay Marine Park Zoning Plan it remains a concern since it has the potential to seriously erode the effectiveness of the MNPZs. Levels of education and enforcement need to be increased if conservation outcomes are to be achieved.
References
- Halpern BS. 2003. The impact of marine reserves: Do reserves work and does reserve size matter? Ecological Applications. 13(1):S117-S137
- Lester SE, Halpern BS, Grorud-Colvert K, Lubchenco J, Ruttenberg BI, Gaines SD, Airamé S, Warner RR. 2009. Biological effects within no-take marine reserves: A global synthesis. Marine Ecology Progress Series. 384:33-46
- Edgar GJ, Stuart-Smith RD, Willis TJ, Kininmonth S, Baker SC, Banks S, Barrett NS, Becerro MA, Bernard AT, Berkhout J. 2014. Global conservation outcomes depend on marine protected areas with five key features. Nature. 506(7487):216
- Babcock RC, Shears NT, Alcala AC, Barrett NS, Edgar GJ, Lafferty K, Mcclanahan TR, Russ GR. 2010. Decadal trends in marine reserves reveal differential rates of change in direct and indirect effects. Proceedings of the National Academy of Sciences. 107(43):18256-18261
- Worm B, Barbier EB, Beaumont N, Duffy JE, Folke C, Halpern BS, Jackson JB, Lotze HK, Micheli F, Palumbi SR. 2006. Impacts of biodiversity loss on ocean ecosystem services. Science. 314(5800):787-790
- Queensland Government. 2007. Marine parks (Moreton Bay) zoning plan 1997. Marine Park Act 2004. Environmental Protection Agency, Queensland Government.
- Stevens T, Connolly RM. 2005. Local-scale mapping of benthic habitats to assess representation in a marine protected area. Marine and Freshwater Research. 56:111-123
- Stevens, D. L., Olsen, A. R. 2004. Spatially balanced sampling of natural resources. Journal of the American Statistical Association. 99:262-278
- Pillans S, Pillans R, Johnstone R, Kraft P, Haywood M, Possingham HP. 2005. Effects of marine reserve protection on the mud crab Scylla serrata in a sex-biased fishery in subtropical Australia. Marine Ecology Progress Series. 295:201-213
- Terres MA, Lawrence E, Hosack GR, Haywood MD, Babcock RC. 2015. Assessing habitat use by snapper (Chrysophrys auratus) from baited underwater video data in a coastal marine park. PLoS ONE. 10(8):e0136799
- SeaGIS Pty. Ltd. Measurement Science Specialists. www.seagis.com.au
- Watson, DL 2006. Use of underwater stereo-video to measure fish assemblage structure, spatial distribution of fishes and change in assemblages with protection from fishing. [PhD]. Western Australia: University of Western Australia.
- Allen, G. 1997. Marine fishes of tropical Australia and South-East Asia. Francis Street, Perth, Western Australia 6000: Western Australian Museum.
- Allen, GA. 1997b. Marine fishes of the Great Barrier Reef and South-East Asia. Western Australian Museum, Francis St., Perth, Western Australia, 6000.
- Johnson, J. 2010. Fishes of the Moreton Bay Marine Park and adjacent continental shelf waters, Queeensland, Australia. Memoirs of the Queensland Museum – Nature 54(3): 99-353
- Kuiter, RH. 2002a. Guide to sea fishes of Australia. Frenchs Forest, NSW: New Holland Publishers
- Kuiter, RH. 2002b. Fairy and rainbow wrasses and their relatives – a comprehensive guide to selected labroids. Soelsbridge Lane, Chorleywood, Herts WD3 5SX, UK: TMC Publishing
- Last, PR, Stevens, JD, Swainston, R, Davis, G. 2009. Sharks and Rays of Australia. CSIRO
- Randall, JE, Allen, GR, Steene, RC. 1997. Fishes of the Great Barrier Reef and Coral Sea. University of Hawaii Press
- Frose R, Pauly D. 2018. Fishbase. [Accessed: June, 2018. Available from: www.fishbase.org.
- Priede, IG, Bagley, PM, Smith, A, Creasey, S, Merrett, NR 1994. Scavenging deep demersal fishes of the Porcupine Seabight, North-East Atlantic: Observations by baited camera, trap and trawl. Journal of the Marine Biological Association of the United Kingdom. 74:481-498
- Venables W, Ripley B. 2002. Modern applied statistics with S. 4th ed. Springer-Verlag, New York
- R Development Core Team. 2010. R: A language and environment for statistical computing. R Foundation for Statistical Computing. Vienna, Austria. ISBN 3-900051-00-3. URL http://www.R-project.org/
- Queensland Government 2019 Size and possession limits – tidal waters. [Accessed February, 2019. Available from: https://www.qld.gov.au/recreation/activities/boating-fishing/rec-fishing/rules/limits-tidal
- MacDiarmid A, Butler Iv MJ. 1999. Sperm economy and limitation in spiny lobsters. Behavioral Ecology and Sociobiology. 46(1):14-24
- Rondeau A, Sainte-Marie B. 2001. Variable mate-guarding time and sperm allocation by male snow crabs (Chionoecetes opilio) in response to sexual competition, and their impact on the mating success of females. The Biological Bulletin. 201(2):204-217
- Sato T, Ashidate M, Goshima S. 2005. Negative effects of delayed mating on the reproductive success of female spiny king crab, Paralithodes brevipes. Journal of Crustacean Biology. 25(1):105-109
- Sato T, Ashidate M, Jinbo T, Goshima S. 2006. Variation of sperm allocation with male size and recovery rate of sperm numbers in spiny king crab Paralithodes brevipes. Marine Ecology Progress Series. 312:189-199
- Kenyon R, Dell Q, Tonks M, Lawrence E, Moeseneder C, Miller M, Edgar S, Babcock R. 2011. Spatial and temporal variation in the human use of the Moreton Bay Marine Park: Impacts of new zoning. (Final Report). CSIRO Marine and Atmospheric Research. Ecosciences Precinct, Brisbane
- Kenyon R, Babcock R, Dell Q, Lawrence E, Moeseneder C, Tonks M. 2019. Non-extractive human use and vessel characteristics in Moreton Bay Marine Park following rezoning. In: Tibbetts IR, Rothlisberg PC, Neil DT, Homburg TA, Brewer DT, Arthington AH (Eds). Moreton Bay Quandamooka & Catchment: Past, present and future. The Moreton Bay Foundation, Brisbane, Australia
- Ryan S, Clarke, K. 2005. Ecological assessment of the Queensland Marine Aquarium Fish Fishery. Queensland Government, Brisbane
- Grandcourt EM, Al Abdessalaam TZ, Al Shamsi AT, Francis F. 2006. Biology and assessment of the painted sweetlips (Diagramma pictum (Thunberg, 1792)) and the spangled emperor (Lethrinus nebulosus (Forsskål, 1775)) in the southern Arabian Gulf. Fishery Bulletin. 104(1):75-88
- Andrews AH, Kalish JM, Newman SJ, Johnston JM. 2011. Bomb radiocarbon dating of three important reef-fish species using Indo-Pacific δ14c chronologies. Marine and Freshwater Research. 62(11):1259-1269
- Marriott R, Jarvis N, Adams D, Gallash A, Norriss J, Newman S. 2010. Maturation and sexual ontogeny in the spangled emperor Lethrinus nebulosus. Journal of Fish Biology. 76(6):1396-1414