-
Previous paper
Trace metal contamination and distribution in sediments of Moreton Bay: An historical review
Guia Morelli1,2, Massimo Gasparon1,3 -
This paper
Moreton Bay and catchment urban expansion and vegetation change
Mitch Lyons, Stuart Phinn, Chris Roelfsema -
Next paper
Water quality in Moreton Bay and its major estuaries: Change over two decades (2000-2018)
Emily Saeck1,2, James Udy3,4, Paul Maxwell1,5, Alistair Grinham5, David Moffatt6, Sivakumar Senthikumar1, Danielle Udy7, Tony Weber7
Moreton Bay and catchment urban expansion and vegetation change
Authors
Mitch Lyons, Stuart Phinn, Chris RoelfsemaAuthor affiliations
School of Earth and Environmental Sciences, The University of Queensland, St. Lucia, Qld, 4072, Australia
Corresponding author
m.lyons@uq.edu.auORCID
Mitchell Lyons: https://orcid.org/0000-0003-3960-3522
Stuart Phinn: https://orcid.org/0000-0002-2605-6104
Chris Roelfsema: https://orcid.org/0000-0003-0182-1356
Book
Moreton Bay and catchment urban expansion and vegetation change
Chapter
Research Paper Title
Moreton Bay and catchment urban expansion and vegetation change
Cite this paper as:
Lyons M, Phinn S, Roelfsema C. 2019. Moreton Bay and catchment urban expansion and vegetation change. In Tibbetts, I.R., Rothlisberg, P.C., Neil, D.T., Homburg, T.A., Brewer, D.T., & Arthington, A.H. (Editors). Moreton Bay Quandamooka & Catchment: Past, present, and future. The Moreton Bay Foundation. Brisbane, Australia. Available from: https://moretonbayfoundation.org/
DOI
10.6084/m9.figshare.8073791
ISBN
978-0-6486690-0-5
Abstract
Here we describe changes in the Moreton Bay catchment via two remote sensing trajectory analysis methods, both of which are derived from Landsat satellite imagery. First, we describe changes in vegetation cover from a time-series of woody vegetation cover products. We focus on the absolute areas and spatial patterns in vegetation clearing across a time series between 1988 to 2015, focusing on the Brisbane, Pine, Logan and Caboolture River Catchments. We highlight several heavy clearing hotspots, as well as individual years in which clearing increased markedly. Second, we summarise the historical change from a time-series of categorical land cover and land use maps, with a focus on urban expansion. Our analysis shows a steady spread of urban areas outwards from highly developed areas, and a spread of lower density urban areas consistent with the increase in ‘rural residential’ and ‘lifestyle block’ developments.
Keywords: Landsat, remote sensing, time series, urbanisation, tree cover, satellite image
Introduction
As described in detail in the papers in Chapter 3, this volume, south east Queensland’s catchment has been significantly modified since the 1970s, including: extensive urbanisation; construction of dams and water impoundments; decreases in agricultural land use; and significant changes in vegetation cover. The availability of long term satellite image archives, along with modern computing resources, has seen a rapid growth in methods that utilise time-series analyses for studying and detecting changes in land use and land cover dynamics. Trajectory analysis (as these methods are commonly referred to) from landscape scale analysis from satellite imagery is generally divided into two main approaches: (i) those that detect either abrupt or long-term change that moves a system from one state to another, or (ii) those that explicitly aim to detect and monitor disturbance and recovery trends (1). We describe changes in the Moreton Bay catchment via two such trajectory analysis methods, both of which are derived from Landsat satellite imagery. First, we describe changes in vegetation cover from a time-series of woody extent and foliage projective cover (%), with a focus on land clearing. Second, we summarise the historical change from a time-series of categorical land cover and land use maps, with a focus on urban expansion.
Land clearing in south east Queensland (SEQ)
The Statewide Landcover and Trees Study (SLATS; https://www.qld.gov.au/environment/land/management/mapping/statewide-monitoring/slats) is a vegetation monitoring program, coordinated by the Queensland Government’s Department of Science, Information Technology and Innovation (3). The program maps and monitors the extent of woody vegetation, with a focus on determining the location, timing and extent of vegetation clearing. The methods include a combination of automated and manual mapping techniques, based on ancillary field data and Landsat satellite imagery. The backbone of the methodology is estimation of foliage projective cover (FPC), the fraction of ground covered by foliage from a ‘birds eye view’, in each Landsat pixel. Time-series of this information was then used to estimate the change in extent of woody vegetation (trees, shrubs and lianas) and the associated clearing rates. Danaher et al. (2) give background on the approach, and the SLATS website (3) describes current methodology, publications and products.

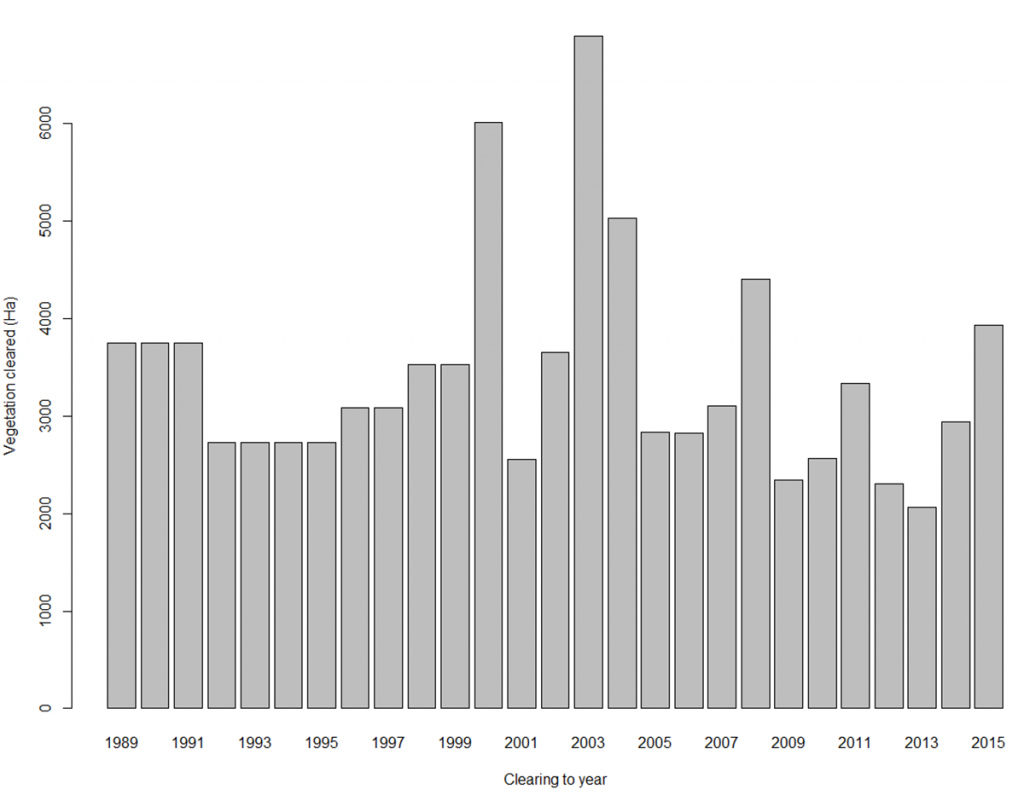
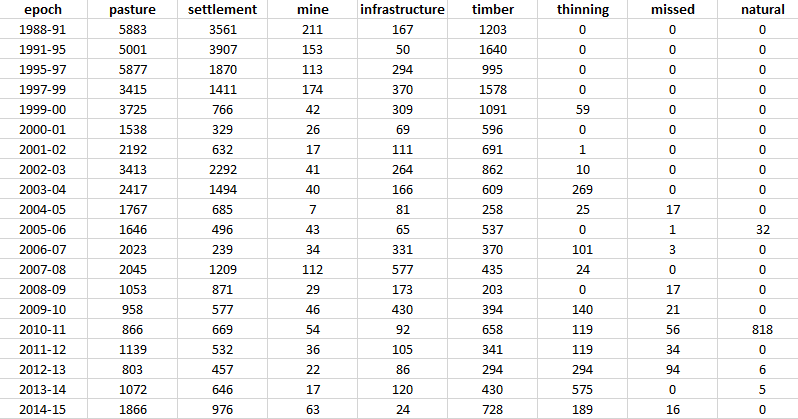
The FPC products are able to show the temporal trend in the intensity of woody vegetation clearing in SEQ between 1988 and 2015 (the years Landsat has been collecting imagery) for the Brisbane, Pine, Logan and Caboolture River Catchments (Fig. 1). Note the clusters of heavier clearing activity, corresponding to a mixture of the development of Brisbane’s residential and commercial property, as well as clearing for agriculture and forestry. Examples include housing development at Springfield Lakes, development and clearing at Yarrabilba, Esk State Forest and the Mount Hallen rural developments, and agricultural and commercial development around the mouth of the Caboolture River. The FPC data can also be summarised to show the yearly clearing totals from 1988 to 2015 (Fig. 2). Note the peaks and troughs in clearing activity, some of which may correspond to changes in clearing legislation, but would need to be confirmed with more detailed study. The FPC mapping and clearing statistics process also provide a more detailed summary on the types of land use that replaces woody vegetation from 1988 to 2015 (Table 1).
Table 1. Woody vegetation clearing (in hectares) by replacement land cover (1988 to 2015) in the Brisbane, Pine, Logan and Caboolture River Catchments. Data come from the Queensland Government’s Statewide Landcover and Tree Survey (SLATS).
Urbanisation in south east Queensland
Using an archive of maps of South East Queensland from Lyons et al (4; https://doi.pangaea.de/10.1594/PANGAEA.843545), we examined the progressive change in the extent of urban areas over the past few decades. The maps were derived from Landsat satellite imagery using object-based image analysis. The maps summarised land cover and land use into the following categories: urban (urban or built area and urban-vegetation mixture); agricultural, non-persistent vegetation (grass, sparse/non-photosynthetic vegetation; bare sand, bare ground); and forest vegetation (closed canopy forest and other dense vegetation, and open canopy forest). Full details on the methods are given in Lyons et al. (4). This approach differs from the SLATS woody cover analysis because the urban cover classes were explicitly mapped as opposed to vegetation being the only parameter of interest.

South east Queensland has experienced rapid and wide spread population growth in the last few decades, and a very clear spatial trend of continued outward urban expansion was visible across the time-series (Fig. 3a). The trend showed that the later stages of development were encroaching on a larger spatial extent of the landscape, but the total area of new developed land was not increasing. That is, smaller individual developments or low density developments were built over relatively large areas. This is consistent with the increase of “rural residential” and “lifestyle block” type developments, where areas between developed sites are still mapped as vegetation proper. The corresponding map of vegetation clearing (Fig. 3b) showed that forest cover was the main vegetation type to be cleared for development. Note that the map of vegetation clearing does not necessarily match the chronology of urban development, since development does not always directly follow land clearing. For example, clearing rates were higher than average in 2003 (see Fig. 2) and trended downwards to 2013 whereas development did not reflect this trend.
Conclusion
Remote Sensing provides a powerful tool to examine historical changes and trends in land cover change. We have shown two remote sensing-based trajectory analysis methods that provide insight into the historical trends of vegetation clearing and the patterns of urbanisation in South East Queensland. The results from these analyses can be further interrogated and used to make explicit links between past actions, threatening processes and potential mitigation or palliative action. Key items of interest would be: (i) examining the spatial distribution of development and development types (e.g. low- vs high-density), and linking these analyses to biodiversity outcomes, and (ii) analysing the trends over time in clearing rates (e.g. the cyclical nature of the clearing totals) and how this potentially relates to changes in vegetation and biodiversity legislation as well as government cycles. Overall it highlights the importance of continuing to invest in remote sensing-based methods as new imagery is acquired into the future.
References
- Kennedy RE, Andréfouët S, Cohen WB, Gómez C, Griffiths P, Hais M, Healey SP, Helmer EH, Hostert P, Lyons MB. 2014. Bringing an ecological view of change to landsat‐based remote sensing. Frontiers in Ecology and the Environment. 12(6):339-346
- Danaher TJ, Wedderburn-Bisshop GR, Kastanis LE, Carter JO. 1998. The Statewide Landcover and Trees Study (SLATS)-monitoring land cover change and greenhouse gas emissions in Queensland. Proceedings of the 9th Australasian Remote Sensing and Photogrammetry Conference, Sydney, Australia
- Queensland Government. Statewide Landcover and Trees Study (SLATS). [Accessed: 20 February 2017]. Available from: https://www.qld.gov.au/environment/land/management/mapping/statewide-monitoring/slats
- Lyons MB, Phinn SR, Roelfsema CM. 2012. Long term land cover and seagrass mapping using landsat and object-based image analysis from 1972 to 2010 in the coastal environment of South East Queensland, Australia. ISPRS Journal of Photogrammetry and Remote Sensing. 71:34-46