-
Previous paper
Changes in fish and crab abundance in response to the Moreton Bay Marine Park rezoning
Michael Haywood1, Richard Pillans1, Russ Babcock1, Emma Lawrence2, Ross Darnell2, Charis Burridge2, Darren Dennis1, Anthea Donovan1, Sue Cheers1, Robert Pendrey1, and Quinton Dell1 -
This paper
Non-extractive human use and vessel characteristics on Moreton Bay following marine park zoning
Rob Kenyon1, Russ Babcock1, Quinton Dell1, Emma Lawrence2, Christian Moeseneder1 and Mark Tonks1
Non-extractive human use and vessel characteristics on Moreton Bay following marine park zoning
Authors
Rob Kenyon1, Russ Babcock1, Quinton Dell1, Emma Lawrence2, Christian Moeseneder1 and Mark Tonks1Author affiliations
- CSIRO Oceans and Atmosphere , Queensland Biosciences Precinct, 306 Carmody Road, St Lucia, Qld 4067, Australia
- CSIRO Data61, Ecosciences Precinct, GPO Box 2583, Brisbane, Qld 4001
Corresponding author
rob.kenyon@csiro.auORCID
Rob Kenyon: https://orcid.org/0000-0002-4053-8142
Russ Babcock: https://orcid.org/0000-0002-7756-1290
Quinton Dell: https://orcid.org/0000-0001-8421-5700
Emma Lawrence: https://orcid.org/0000-0001-9018-6010
Christian Moeseneder: https://orcid.org/0000-0002-6718-1913
Book
Non-extractive human use and vessel characteristics on Moreton Bay following marine park zoning
Chapter
Research Paper Title
Non-extractive human use and vessel characteristics on Moreton Bay following marine park zoning
Cite this paper as:
Kenyon R, Babcock R, Dell Q, Lawrence E, Moeseneder C, Tonks M. 2019. Non-extractive human use and vessel characteristics on Moreton Bay following marine park zoning. In Tibbetts, I.R., Rothlisberg, P.C., Neil, D.T., Homburg, T.A., Brewer, D.T., & Arthington, A.H. (Editors). Moreton Bay Quandamooka & Catchment: Past, present, and future. The Moreton Bay Foundation. Brisbane, Australia. Available from: https://moretonbayfoundation.org/
DOI
10.6084/m9.figshare.8085719
ISBN
978-0-6486690-0-5
Abstract
The Moreton Bay Marine Park (MBMP) is a multiple-use marine park in eastern Australia that was established in 1993 and rezoned in 2009 by Queensland’s Environmental Protection Agency, thereby increasing the total no-take area of marine national park from 0.5 to 16%. In conjunction with measured trends in the human use of no-take areas before and after rezoning (previously reported by the authors (37)), we documented vessel use and characteristics of vessels in MBMP by way of on-water and aerial surveys. About 35% of vessel-based activity in the marine park was non-extractive use. Fishing was the dominant activity in the MBMP (65%), both within Moreton Bay itself and on nearby offshore waters, and recreational fishing comprised 97% of all fishing activity. Despite a thirty-fold increase in no-take area in the MBMP, there was minimal change in the spatial distribution of all on-water activities, including recreational fishing.
Vessels with overnight accommodation capacity (lifestyle vessels) comprised about 20% of vessel activity in the marine park. Sailing, sightseeing, jetskiing, paddling and camping made up significant proportions of other vessel-based activity. Small vessels < 5m in length made up 50% of all vessel length classes. The largest vessels encountered in MBMP were not found offshore; they were ‘weekender’ lifestyle vessels frequenting the many safe anchorages within the Bay. Vessels in the 5–8m length range were the most common vessels operated offshore. The majority of vessels (80%) had one or two people onboard, while offshore three to four people per vessel was common. Available leisure time and weather impacted the use of the marine park; all vessel types were observed more often on weekends and when forecast wind speed was low.
Keywords: spatial management, no-take zones, on-water observations, vessel operation, fishing, fishing gear, leisure time, weather forecast
Introduction
Marine protected areas (MPAs) are spatial management tools used extensively worldwide, primarily to conserve marine biodiversity (1–6). They include ‘no-take’ zones that prevent human extractive uses and displace extractive users to other fishing locations. Management by input controls, such as ‘no-take’ zones, reduces the effort deployed spatially or temporally in the fishery; as opposed to output controls that do not restrict effort but restrict ‘take-home’ catch by means such as bag limits. MPAs affect fishers’ behaviour by permanently reducing effort in selected areas (7, 8). Input controls are more conservative than output controls in that they reduce incidental mortality caused unintentionally, such as catching undersize fish that are returned to the sea, but the fish may perish due to barotrauma and handling (9).
In addition to conserving biodiversity, MPAs may have positive effects for non-extractive uses such as recreation, education (10) and aesthetics (3, 11, 12). They also can be valuable tools for research and adaptive management (13). However, quantitative studies of the benefits or costs of MPAs for non-extractive purposes are not common.
Non-extractive activities may be more highly valued by visitors to MPAs than extractive-use values (14) and command an economic premium. For example, scuba divers are more willing to accept restrictions to their activity if they can expect to see more marine life in an MPA (15, 16). Given a high willingness to pay for non-extractive values, no-take marine reserves may add significantly to a local economy by enhancing the perceived enjoyment of a natural feature.
At a regional scale, the economic performance of coastal cities and communities adjacent to the Great Barrier Reef Marine Park (GBRMP) is underpinned by tourism. Thus, marine conservation and marine parks are key components of the economy. In 2017, the Great Barrier Reef’s (GBR) economic, social and iconic value to Australia was estimated at $56 billion. In the GBR region, tourism was worth $6.4 billion per year and it supported 64,000 jobs (17). At the same time, commercial fishing and aquaculture was worth $199 million (17). Historically, the value of tourism among the GBRMP regional industries has been a far larger component (28%) of gross value of production than fishing (1%) (18). The sustainability of the GBR was strengthened by the creation of no-take zones; introduced and expanded by the Australian Government through the Great Barrier Reef Marine Park Authority, but broadly supported by the general public via the definition of conservation objectives, data-supported substantiation, community education and social licence (19). Likewise, at ‘single-site’ spatial scales, tourism at the Leigh Marine Reserve (New Zealand) was estimated to bring 100,000 visitors per year, contributing substantially to the local economy (20).
Considering the competing uses of marine park resources, it makes economic sense to carefully evaluate the balance between extractive and non-extractive uses. Specific examples of economic input to Australia from non-extractive use of the GBRMP include the direct and indirect economic values of tourism (17), the visitor experience in dwarf minke (Balaenoptera acutorostrata) whale tourism in the northern GBR (21), and changing visitor perceptions (22).
Internationally, the evaluation of the non-market resource value of MPAs, in particular, and marine ecosystems, in general, demonstrates a direct economic benefit that often surpasses value to the region measured in more traditional ways (23–28). The high non-market value reflects an estimate of the value of global ecosystem services and ‘natural capital’ that is about double the global gross national product; mainly through the MPA’s contribution to human wellbeing (29, 30). To give a specific example, the value of extractive commercial fishing in the Florida Keys was dwarfed by the non-market value of recreational activities within an MPA which was established to maintain and improve the value of the coral reef ecosystem, particularly coral and fish abundance and biodiversity. MPA non-extractive users were 40–80% more likely to visit the Keys and enjoyed a 69% more valuable experience on a reef ecosystem where reef quality was protected by the MPA (23). These trends mimic those measured in the GBR, Australia (17). Even in the planning of MPA boundaries and zoning categories, experiential expectation of MPA use demonstrates subtle differences. For example, in British Columbia, the prospect of non-extractive use by boaters operating sail or motor vessels in a proposed MPA was investigated by face-to-face questionnaires (31). Sailboaters valued the natural environment; they rated a pristine environment more highly, and valued access to built facilities and fishing less highly than motorboaters (31). The targeted use of pristine MPAs will enhance the economy of a region and offer non-market benefits that are even more difficult to differentiate than most measures of non-market value in comparison to the traditional economic indicators, such as market value of landed fish and crustaceans. Differences in experiential expectation as boaters use waterways could be used to better plan the zoning of the MPA (31). In the case of Moreton Bay, the contrast between the high value of conservation benefits from MPAs close to a major urban population, and the opportunity cost associated with historical use for extractive commerce (e.g. the oyster growing industry) is evident (32). Aquaculture must operate with maximum efficiency to compete with the maintenance of ecosystem services and biodiversity outcomes supported by MPA conservation, if commercial activity was not to be displaced.
The Moreton Bay Marine Park (MBMP) was established in 1993 and includes 3400km2 along the southern Queensland coast (Fig. 1). The management of the park was reviewed in 2007 to protect a greater percentage of marine habitats with a stated objective to ‘provide for the ecologically sustainable use of the Moreton Bay Marine Park and to protect its natural, recreational, cultural heritage and amenity values’ (33). Park managers analysed data, gathered scientific advice and consulted stakeholders to minimise impacts on users. Simultaneously, an alliance of commercial and recreational fishers, fishing retailers and wholesalers and others undertook a similar socioeconomic/biological analysis and developed an alternative plan, aspects of which were adopted (34, 35). The new zoning plan came into effect in March 2009, increasing no-take marine national park (MNP) zones from 0.5% to 16% (36). The design of the rezoning was successful in minimising the impact of rezoning on extractive users (37). Despite the 300% increase in the aerial extent of MNP zones, just 6.7% of fishers in MBMP were displaced (37). The low displacement of extractive users was due to an informed placement of no-take zones relative to locations of high extractive use and realignment of some no-take zone boundaries following public consultation (38), including the Minister for National Parks personally speaking to conservation, commercial and recreational fishing stakeholder peak bodies.
We sampled the MBMP, observing non-fishing activities, fishing and vessel characteristics in MNP and conservation park zones (CPZs), compared with habitat protection zones (HPZs) and general use zones (GUZs) as control areas using both on-water and aerial surveys, both before and after rezoning. HPZs do not exclude recreational and commercial fishing, apart from trawling, so they were included in our control areas. Importantly, we gathered data on the suite of usage types of Moreton Bay and the non-extractive use by recreational and commercial users. Though MPAs are used as a tool for biodiversity conservation, their amenity and attractiveness to non-extractive users has economic value and social impact (17, 19). This study investigates the potential for significant value to accrue to non-extractive users of Moreton Bay due to the increase in MNP zoning.
Methods
Study area
The MBMP is located in South East Queensland, Australia, including Moreton Bay and adjacent offshore waters (3 to 20 km offshore, maximum depth of about 150 m) (37). It stretches 125 km from 26° 48.5’ S to 27° 58.0’ S encompassing the Bay’s tidal waters, including many estuaries, and extends seawards to the limit of Queensland state territorial waters (Fig. 1).
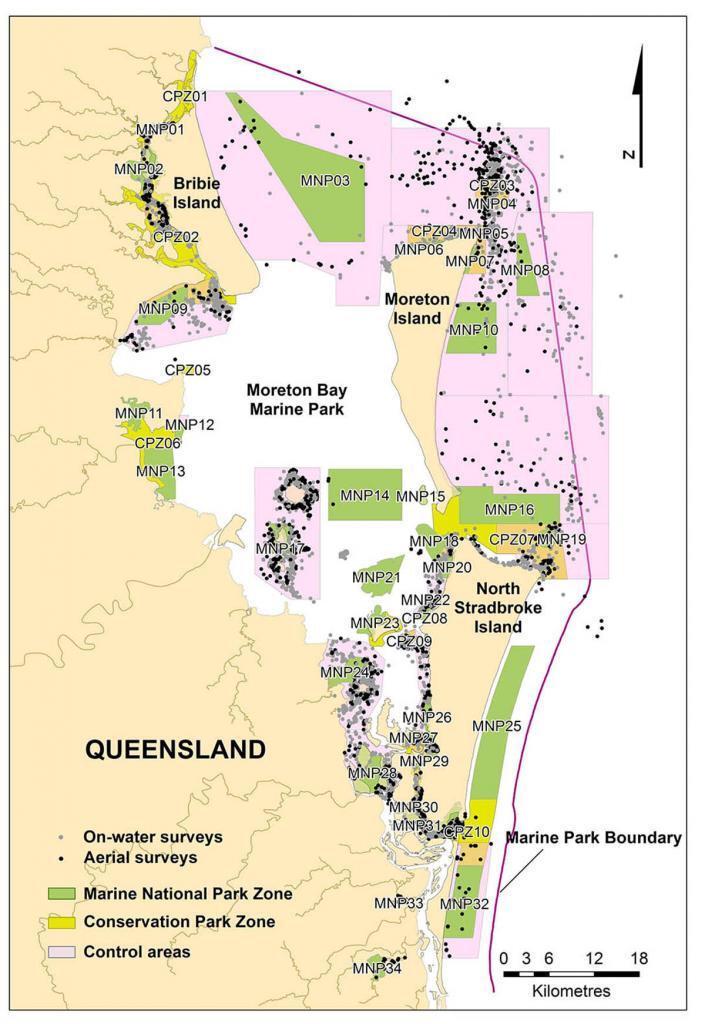
Four levels of zoning were implemented in the MBMP impacting the activities of recreational and commercial fishers, and possibly other park users. MNP zones are the most restrictive for fishers, with no extractive activity allowed. CPZs allow fishing and some collecting, but trawling and the majority of commercial netting are not allowed (recreational bait netting and a specific N11 commercial net endorsement are allowed, though whiting (Sillago sp.), bream (Acanthopagrus sp.) and flathead (Platycephalus sp.) may not be retained). HPZs allow netting, but not trawling. Trawling and all other legal activities are allowed in the GUZs. Here we restrict our analysis to the MNP zones as ‘impact’ areas and adjacent GUZs and HPZs as control areas.
Data collection
We recorded non-extractive activities, extractive use and vessel characteristics in the MNP and adjacent control areas (areas with similar habitat and bathymetry to the MNP) of the MBMP using both vessel and aerial surveys. The extractive use and impact of MPA zoning on fishing activities were reported by Kenyon et al. (37). The categories of human use and vessel descriptors used are detailed in Table 1.
The on-water sampling program was based on the proposed zoning plan using a BACI-pairs experimental design (38). The statistic analysed was the proportion of vessels in the MNP as a percentage of all vessels within the MNP and control area. Thus it was independent of area surveyed, time-of-day, weather etc., as all factors affecting the MNP also affected the paired control area (37).
Table 1. Vessel type and activity classifications that were collected during on-water surveys. Lifestyle vessels supported day or overnight trips, usually with cooking facilities and sleeping accommodation on-board. Similar vessels were lived on permanently by some bay users. Note that it is possible for a single vessel to fall into two or more categories e.g. fishing and lifestyle vessels.
| Categories | Activity classification/characteristics |
|---|---|
| Vessel type | |
| Dinghy | Small outboard vessel: aluminium, fibreglass, timber |
| Canopy dinghy | Small outboard vessel: aluminium, fibreglass, timber – with canopy |
| Cabin runabout | Outboard vessel with fo’c’sle not used for sleeping |
| Cabin | Fo’c’sle or cabin designed for sleeping accommodation |
| Walk-through | Passenger seating placed forward of steering position |
| Walk-around | Central cabin accommodation with full deck access fore and aft |
| Centre console | Steering from a central pod; limited or no passenger seating/accommodation |
| Speedboat | Outboard or inboard vessel with minimal passenger accommodation built for watersport (e.g. waterskiing) |
| Bass boat | Low freeboard, flush-deck vessel designed as a calm-water fishing platform |
| Yacht sailing | Yacht deriving propulsion from sail power (active sailing experience), possible engine thrust engaged |
| Yacht under motor | Yacht being propelled by engine power, not sail |
| Houseboat | Vessel designed for calm-water conditions with maximum cabin space |
| Kayak | One or two person paddle craft |
| Jetski | Personal powered watercraft |
| Vessel in transit | Type as per category above, speed and heading estimated |
| Vessel size | <5 m, 5–8 m, 8–10 m, 10–15 m, >15 m |
| Propulsion type | Inboard motor, outboard motor, sail |
| Hull design | Planing, Displacement |
| Activity | |
| Fishing | Primary activity in Moreton Bay Marine Park is fishing; e.g. line, pot or spear (recreational/ commercial) |
| Diving | Primary activity is diving; SCUBA (recreational/ commercial) |
| Whale watching | Primary activity is whale watching, usually from a commercial tour vessel |
| Sightseeing | Primary activity is less well defined, but specific appreciation of a component of the natural environment (no overnight accommodation), |
| Lifestyle | Primary mode of transit an engine-powered vessel with overnight accommodation, but general appreciation of the natural environment a significant component, vessel operators may fish. |
| Live-aboard | Vessel is the permanent primary residence. |
| Yachting | Primary mode of transit is wind-propelled vessel operation (pleasure activity) |
| Jetskiing | Primary activity is the operation of personal watercraft for pleasure alone |
| Fishing gear | Baited line-anchored, baited line-drifting, trolling, casting lures, casting soft plastic lures, pots/dillies, yabby pumping, bait netting, cast netting, beach fishing (land based), beach fishing (initial vessel transit), spear fishing (boat based), spear fishing (land based), searching, resting |
Boat-based surveys
Prior to MNP implementation, there were six rounds of surveys conducted monthly between August 2008 and January 2009. After MNP implementation (1 March 2009), sampling was conducted every two months for 12 surveys between April 2009 and March 2011. Due to the timing of the rezoning, it was not possible to fully balance the sampling design for the season before and after rezoning. Prior to MNP implementation, review of the MBMP, including public information sessions and submissions, was well advanced (33). We have presumed that the behaviour of fishers was not changed during the public consultation process prior to implementation of the new zoning plan.
The on-water monitoring sampled both vessel- and land-based fishing activities as well as all vessel-based non-fishing activities such as passive anchoring, tow-sports, sailing, diving, or transiting the survey areas. Twenty-one of the 34 MNPs were regularly surveyed. The MNP zones, distributed along the length of the Bay, included a range of habitats from shallow, inshore bays and estuaries to offshore rocky reefs (Fig.1). The greatest numbers of survey days were undertaken on weekdays, and 53% of MNPs were visited during mornings, 47% during afternoons. Thirty-three per cent of surveys were done on weekends. For a series of MNPs, the survey vessel track was predetermined and recorded by GPS on each survey.
On-water monitoring was completed in sets of observations over consecutive days. We observed, located and inventoried all vessels in each MNP and associated control areas. If required, we deviated from our path to ascertain details of distant vessels before returning to the track. During each on-water survey, vessel locations (recorded by GPS), vessel descriptions and activities were annotated on data sheets.
Aerial surveys
The aerial surveys provided coverage of the entire study site in one day (refer to (37)). Aerial surveying covered the 21 MNPs that the on-water surveys covered, as well as additional study areas at South Stradbroke Island (MNP32), McCoys Creek (MNP33) and Coombahbah Lake (MNP34) (Fig. 1). For the pre-zoning period, the three surveys were conducted once a month from November to January 2008–09. After rezoning of the MNPs, aerial surveys were conducted monthly from November to January 2009–10 (three surveys). Each flight lasted about 2.5–3.5 hours, depending on vessel density. Flights were conducted from an over-wing aircraft at low-level (~125 m) and low-speed (90 to 100 knots) and a GPS recorded the aircraft flight path.
During each flight, vessel descriptions and locations were annotated on maps noting vessel activities and nearby geographical features and man-made markers. The maximum error of near-shore position estimates was approximately 50m and in open bay and offshore areas approximately 200 m. Vessels operating in featureless open water were plotted using the handheld GPS with a maximum 50° arc of lateral observation from vertical. The maximum error of these position estimates was approximately 600 m.
Vessel size and people per vessel
The vessels described by size and occupancy include all vessels observed: vessels in transit, vessels for which activity could be categorised, and vessels for which activity was unable to be categorised but for which size could be reliably estimated. The total number is higher than those vessels for which analyses of vessel activity were undertaken. Data for both on-water and aerial surveys are combined.
Spatial processing and data analysis
Spatial processing
Spatial data were mapped using GIS (ESRI ArcGIS versions 9.3 and 10). The positions of observed vessels and tracks of survey boats and airplanes were mapped on shapefiles to an accuracy of ±15m. The precision of vessel location mapped on shapefile was dependent on the method of vessel position recording (37). As mentioned above, the locations of on-water vessel observations and the tracks of survey vessels were mapped precisely. However, position estimates during aerial surveys had lower levels of precision relative to the precisely mapped track of the survey aircraft, though geographical features and navigation marks were used to improve the precision of location estimates (37). Control area boundaries were created by manually positioning nodes or subtraction of MNP polygons where overlap with a control area existed.
Statistical analyses of human use data
For each of the surveyed MNPs, the average number of vessels per survey, day-of-the-week, season and vessel activity were included in the analysis. Generalised linear models (GLMs) (40) were used to compare the mean proportions of vessels (total vessels, fishing vessels, non-fishing vessels) in MNP and control areas, accounting for day of week or season.
As the data are over-dispersed, the models were fitted based on the negative binomial distribution in the MASS package in R (41). The GLMs for fishing vessels were fitted separately to ‘in-MNP’ and ‘control’ data with fixed-effects estimated for each MNP and paired control area, season (‘summer’, ‘autumn’, ‘winter’, ‘spring’), type of day (‘weekend’ or ‘weekday’) and time of sample (‘before rezoning’ or ‘after rezoning’). Similar models were also fitted for ‘all vessels’ and ‘vessels not fishing’.
The similarity of MBMP zones and paired control areas based on proportions of various types of boating activity observed during the boat-based surveys was investigated using Bray–Curtis similarity ordination (CLUSTER routine in PRIMER software) (42).
To investigate vessel use in relation to environmental factors (weather) and available leisure time (weekends vs weekdays), we used a simple GLM model incorporating several variables: marine national park (MNP), day type (weekend day vs weekday), rain prior day (the observed average rainfall over five locations adjacent to Moreton Bay the day prior to the survey), rain survey (the observed average rainfall over the five locations adjacent to Moreton Bay the day of the survey), wind forecast (the upper limit of the forecast wind range provided by the Bureau of Meteorology (BOM)), wind direction (as forecast by the BOM), and maximum temperature (as forecast by the BOM). The five rainfall locations were Bribie Island (gauge # 40978), Redcliffe (gauge # 40958), Brisbane Airport (gauge # 40842), Steiglitz Wharf (gauge # 540295) and Gold Coast Seaway (gauge # 40764).
The upper and lower limits of the forecast wind range were highly correlated so only one measure was modelled. The same protocol was applied to maximum and minimum temperature. A quasi-poisson distribution was used in the model due to the large amount of variability in the data (partly due to our observations of vessels in a range of diverse MNPs both within and outside Moreton Bay during each survey).
Results
Boating activity in Moreton Bay Marine Park
We completed 75 days of on-water sampling in Moreton Bay Marine Park (25 pre- and 50 post-zoning) collecting 4411 vessel observations, together with 1854 aerial survey observations of stationary vessels (Fig. 1). During the on-water surveys prior to the March 2009 rezoning, 914 vessels were observed (during 6 surveys), whereas after rezoning 3497 vessels were encountered during 12 surveys. Before rezoning, approximately 30% of on-water sample days were conducted on weekends, and about 34% on weekends post-MNP declaration. During aerial surveys, we observed 763 vessels prior to rezoning and made 1091 observations post-declaration. Two hundred and twenty-three vessels observed during aerial surveys (9.9%) were unable to be assigned to activity type. In addition, 1304 vessels were ‘in-transit’ to a destination and were not engaged in an activity that could be categorised. However, their size and number of people onboard could be documented.
The effect of the increased area of no-take zones on the spatial displacement of vessels or change in activity has been described previously by the authors (37); including change to the spatial location of fishing activity in Moreton Bay and offshore adjacent to Moreton and Stradbroke islands. The most common human use by vessel operators was extractive use: fishing (recreational or commercial) (66%). Recreational fishers made up the greatest proportion of all fishers (~97%).
However, as observed during both on-water and from aerial surveys, about 34% of the human use of the marine park from vessels was non-extractive use (37). All vessel-use categories are shown in Figure 2. The most common non-extractive activity on Moreton Bay was being aboard a ‘lifestyle’ vessel (~20%) and this was the second-most common activity of all use types. Lifestyle vessels are large-cabin vessels with food storage and preparation facilities and sleeping quarters. The aim of their operators was to spend time relaxing on Moreton Bay, including non-extractive use. If fishing activity was observed from a lifestyle vessel, the vessel was categorised as ‘fishing’. Observed both on-water and from the air, sailing, sightseeing, jetskiing, paddling, resting and camping made up significant proportions (each <5%) of these non-extractive, on-bay activities (Fig. 2). On about 100 occasions (~2%), the vessels encountered were occupied by people who live permanently on Moreton Bay. These are usually on reasonably large ‘cabin-cruiser’ style displacement hull vessels, as determined by obvious vessel characteristics, from interviews and multiple encounters. Commercial whale-watching vessels operated offshore from June to October (we saw two whale- watching vessels prior to rezoning and seven post rezoning), and offshore fishing charter vessels operated year round (we saw 4 charter vessels prior to rezoning and 23 post rezoning). Some land-based fishing was observed, mostly from Moreton and North Stradbroke islands. The categories of vessel type observed and the activities undertaken in Moreton Bay are summarised in Table 1.

Small vessel operation and characteristics in Moreton Bay Marine Park
Boat-based surveys
Patterns of human use were discerned based on similarity in the types of activities carried out in each MNP area. The majority of MNPs and paired control areas fell into five groups which corresponded to environmental classifications: offshore reefs, offshore open water, lifestyle anchorages, sheltered bay waters, and open bay waters (Fig. 3). Human activities in the control areas of the offshore reefs and open-water habitats were characterised by high proportions of fishing at >75%, as well as diving, sightseeing and whale watching. Fishing activity in the offshore open-water habitats targeted deeper hard-bottom reefs. Diving and sightseeing were prevalent at the offshore reef sites. Several of these reefs are attractive as they have shallow portions accessible to divers (SCUBA and free divers) and visible intertidal sections.
(NP)Vessel anchorage sites located on the western shores of North Stradbroke Island were characterised by higher numbers of lifestyle vessels than any other vessel type, 30–40%. Fishing was common within anchorages that were outside no-take zones, but so were activities such as resting and reading. Waters inside Moreton Bay were characterised by higher levels of fishing than any other activity. A range of other activities such as paddling, jetskiing and resting-at-anchor were observed at similar frequencies. Open bay sites had higher proportions of sailing vessels (142 sailing vessels observed) than the sheltered bay waters (27 sailing vessels observed), although 126 sailing vessels were observed in anchorages some of which were adjacent to open bay waters.
A few atypical outlier MNPs and control areas did not fall into any of the categories above (i.e. Westaways Creek (MNP01), Wild Banks (MNP03) and Cape Moreton (MNP05)). Fishing and whale watching dominated activities at Cape Moreton, while only a few fishers and sailing vessels were seen on Wild Banks, and fishers and jetskiers were common in the vicinity of Westaways Creek.
The average number of vessel observations made in a day was greatest on the weekend days than weekdays. Roughly double the numbers of vessels were encountered on a Saturday or Sunday than on a weekday (Table 2). The highest median number of vessels was recorded on summer days and the lowest in winter (Fig. 4). Autumn showed the greatest variability with 173 vessels on one day and only 14 on another. Spring showed comparatively small variability excluding one large outlier of 208 vessels (Sunday 7/11/2010). Figure 4 emphasises the large amount of variability in the data and the need to include season as a term when modelling the data as they are highly unbalanced.

Table 2. Number of observations (vessels encountered) and mean per day on each day of the week.
| Day | No. of observations | No. of sample days | Mean no. of observations per day |
|---|---|---|---|
| Sunday | 981 | 10 | 98 |
| Monday | 295 | 5 | 59 |
| Tuesday | 473 | 9 | 53 |
| Wednesday | 661 | 11 | 60 |
| Thursday | 482 | 10 | 48 |
| Friday | 723 | 14 | 52 |
| Saturday | 1652 | 14 | 118 |

Vessel type and size and number of people per vessel
Vessels < 8 m make up the great majority of the vessel observations within Moreton Bay and adjacent offshore waters. Vessels < 5m in length were the most common vessels in use on the MBMP, especially within the sheltered waters within Moreton Bay (3891 of 8087 vessels). Five- to eight-metre vessels are the next most common vessel operated (n=2020). Both of these length classes of vessels were dominated by outboard-powered vessels; usually open dinghies, centre console runabouts or cabin runabouts. They are mainly day-use vessels. Vessels in the 10–15-m size class are the next most common vessel class (n=1153). These vessels are dominated by lifestyle vessels that support overnight on-water experiential activity, and yachts. Both of these vessel types have a galley and bunks for food preparation and sleeping, respectively.
Vessels > 5 m dominate the vessel size characteristics at four offshore MNPs: Flinders Reef (MNP04), Deep Tempest (MNP08), Mirapool (MNP16), Flat Rock (MNP19); and at two inshore MNPs: Myora (MNP22) and Willes Island (MNP29) (Table 3). However, the vessel types differ between the inshore and offshore MNPs. The offshore MNPs and control areas require a larger plaining-hull vessel to access them safely. The numerically dominant offshore vessel favoured by fishers was a 5–8-m vessel of either cabin or centre console configuration, usually fibreglass (glass reinforced polyester) or plate-aluminium hulled. In contrast, the typical large vessels at inshore anchorages were lifestyle vessels supporting overnight operation.
Though not numerically dominant, large cabin vessels (>8 m) with capacity to sustain overnight or longer operation were sometimes common offshore, but usually they were engaged in seasonal game fishing, often trolling (i.e. day fishing – not staying out overnight). Some vessels > 15 m were also common offshore, especially commercial dive vessels and whale-watch vessels operating north of Moreton Island (e.g. Flinders Reef).
Annually, large vessels (>10 m) were not numerically dominant offshore (Table 3). Vessels > 10 m were common at inshore MNPs and control areas within Moreton Bay; they were the ‘weekender’ vessels (vessels in the lifestyle category) or yachts anchored in known anchorages overnight. The Myora anchorage (control area near MNP22) was a typical location frequented by lifestyle vessels, as was the anchorage adjacent to the Royal Queensland Yacht Squadron facility on the north-east tip of Russell Island, Canaipa Passage (control area near MNP29).
Table 3. Breakdown of vessel size (in meters) by MNP (including paired control area) as encountered by boat-based surveys. The high numbers of ‘unknown’ vessels at Heath Island, Amity, Point Halloran (Coochiemudlo Island) and Swan Bay are land based beach fishers.
| MNP | <=5 | 5.01-8 | 8.01-10 | 10.01-15 | >15m | Unknown | |
|---|---|---|---|---|---|---|---|
| MNP01 | Westaways Creek | 38 | 1 | 0 | 5 | 0 | 0 |
| MNP02 | Tripcony Bight | 373 | 49 | 13 | 25 | 0 | 4 |
| MNP03 | Wild Banks | 4 | 6 | 7 | 4 | 1 | 0 |
| MNP04 | Flinders Reef | 29 | 140 | 23 | 25 | 11 | 2 |
| MNP05 | Cape Moreton | 3 | 3 | 0 | 0 | 0 | 5 |
| MNP06 | Heath Island | 32 | 12 | 9 | 3 | 1 | 31 |
| MNP08 | Deep Tempest | 2 | 39 | 4 | 9 | 2 | 0 |
| MNP09 | Deception Bay | 193 | 45 | 11 | 9 | 0 | 1 |
| MNP10 | Henderson Rock | 4 | 18 | 1 | 5 | 3 | 1 |
| MNP16 | Mirapool | 2 | 45 | 3 | 8 | 6 | 1 |
| MNP17 | St Helena Is | 269 | 96 | 30 | 54 | 22 | 8 |
| MNP19 | Flat Rock | 36 | 63 | 5 | 0 | 2 | 2 |
| MNP20 | Amity | 86 | 48 | 9 | 12 | 2 | 159 |
| MNP22 | Myora | 34 | 22 | 18 | 83 | 29 | 1 |
| MNP24 | Point Halloran | 284 | 71 | 20 | 61 | 9 | 17 |
| MNP26 | Price anchorage | 72 | 27 | 28 | 42 | 4 | 1 |
| MNP27 | Lamb Is | 12 | 6 | 3 | 4 | 2 | 0 |
| MNP28 | Pannikin Is | 89 | 17 | 4 | 9 | 2 | 0 |
| MNP29 | Willes Is | 69 | 36 | 58 | 112 | 19 | 8 |
| MNP30 | Cobby Cobby | 116 | 47 | 40 | 46 | 6 | 1 |
| MNP31 | Swan Bay | 468 | 133 | 30 | 45 | 10 | 22 |
| Total | 2215 | 924 | 316 | 561 | 131 | 264 |
About 80% of the vessels observed during the boat-based surveys had one or two people onboard, 12% had three people and 8% of vessels had four or more people onboard (Fig. 5). One or two fishers in a < 5-m or 5–8-m vessel were very common.

A few vessels had 20–50 people onboard, usually commercial dive vessels or chartered vessels engaged in sightseeing or whale watching. Yachts and day-vessels not fishing may have three or more people onboard.
The average number of people per vessel was highest in Wild Banks (MNP03 and control area), Henderson Rock (MNP10 and control area) and Mirapool (MNP16 and control area) where the average was > 2.5 persons per vessel. These MNPs are offshore locations accessed by large vessels with more occupants (including charter vessels with >10 passengers). Similarly, an average of 2.4–2.5 people per vessel were observed elsewhere offshore (Flinders Reef, Cape Moreton and Deep Tempest). Inshore, fishers often took their vessels on the Bay alone. Vessels with two people onboard were observed throughout the survey area.
Impact of weather
There were significantly fewer vessels using Moreton Bay when the upper limit of predicted wind speed was high (~15–20 knots) (Table 4). As shown in a previous analysis, a greater number of vessels were observed on the weekends than on weekdays. No other variables (e.g. rainfall or temperature) contributed significantly to the model, due to variability in the data attributed in part to the large number of MNPs sampled in various combinations (Table 4).
Table 4. Environmental variables (derived from weather forecasts and observations) modelled using generalised linear models that may affect the likelihood of vessels operating on Moreton Bay on any day. ‘Day type’ is weekend day vs weekday, ‘rain prior day’ is the observed average rain over five locations (Bribie Island (40978), Redcliffe (40958), Brisbane Airport (40842), Steiglitz Wharf (540295), Gold Coast Seaway (40764)) the day prior to the survey, ‘rain survey’ is the observed average rain at those locations on the day of survey, ‘wind forecast’ is the upper limit of the forecast wind range provided by the Bureau of Meteorology (BOM), ‘wind direction’ as forecast by BOM, ‘maximum temperature’ as forecast by BOM. Df: degrees of freedom.
| Variable | Df | Deviance | Residual Df | Residual deviation | F | Prob (>F) | |
|---|---|---|---|---|---|---|---|
| MNP | 20 | 1578.3 | 316 | 2107.5 | 15.9691 | <0.0001*** | |
| Day type | 1 | 618.08 | 315 | 1489.5 | 125.0738 | <0.0001*** | |
| Rain per day | 1 | 9.69 | 314 | 1479.8 | 1.9606 | 0.162 | |
| Rain survey | 1 | 0.04 | 313 | 1479.7 | 0.0076 | 0.931 | |
| Wind forecast (upper limit) | 1 | 70.83 | 312 | 1408.9 | 14.3329 | 0.0002*** | |
| Wind direction | 5 | 27.91 | 307 | 1381 | 1.1294 | 0.345 | |
| Maximum Temperature | 1 | 0.08 | 306 | 1380.9 | 0.0161 | 0.899 |
Discussion
In the Moreton Bay Marine Park, one-third of on-water users were engaged in non-extractive activities that rely of the geophysical, biological and cultural values of the marine environment to attract their visitation. Being aboard a weekender ‘lifestyle’ vessel was the most popular non-extractive activity; yachting, jetskiing, scuba diving, paddling, sightseeing and whale watching were also enjoyed. Recreational fishing made up the remaining two-thirds of popular activities undertaken both within Moreton Bay itself and on nearby offshore waters, comprising 66% of all activity (37). Elsewhere in Queensland, fishing is also the most popular activity by vessel operators using coastal waters (17, 43); yet regional quantitative comparisons with non-extractive use are sparse. Approximately 35% of recreational fishing in Queensland occurs in the Moreton Bay Region (43) and about 57% in South East Queensland (Brisbane, Sunshine Coast, Wide Bay Burnett).
As reported by Kenyon et al. (37), despite a thirty-fold increase in no-take area in the MBMP, there was minimal change in the spatial distribution of all on-water activities, including recreational fishing. Low spatial displacement was due to the strategic placement of MNP zones as an outcome of science-based planning and community consultation. This included prioritising conservation/no-take zones in areas of high biodiversity but with relatively low historical fishing effort (37, 39). While the main objective of no-take zones is to sustain ecosystem function and biodiversity, leisure activities such as ‘weekends on the water’ (lifestyle vessels), sailing and paddling, and scuba diving were activities that future studies may demonstrate benefit from less fishing activity in MNPs. Over 30% of on-water activity on Moreton Bay and close-in offshore waters is non-extractive. Therefore, given the low displacement of fishers, enhancement of the experience of all MBMP users under 16% coverage of no-take zoning is feasible.
While the numbers of vessels engaged in non-extractive activity in future MNPs were too few to be analysed, the numbers of vessels engaged in all activity types in MNPs increased after rezoning. Few vessels were fishing illegally after zoning (2.6%) (37). Thus, the majority of vessels observed in no-take zones were engaged in non-extractive use. As well, a significant proportion of fishers recorded in no-take zones were located on the boundary of the no-take zones (e.g. at Lamb Island (MNP27) and Swan Bay (MNP31)), perhaps the operators considered they were fishing just outside the zone’s boundary (37). The presence of vessels in no-take MNPs suggests that their operators continue to enjoy an amenity that non-extractive activities provided within these areas.
The numbers of vessels encountered post rezoning increased by about 200%, an increase not fully explained by an increase in vessel ownership and possible vessel use in the Moreton Bay Region during the 2000s (37). Post-rezoning, roughly double the numbers of vessels were encountered during each survey day in each season, a consistent pattern (37). Four per cent more weekend days were surveyed after the MBMP was rezoned and greater numbers of vessels were encountered on weekends (37), both factors enhancing vessel encounters post implementation of the new zoning plan. However, trends in overall vessel use of MBMP require future attention.
Non-extractive users are highly discriminatory in their ‘enjoyment criteria’ and appreciation of particular attributes of on-water locations (31). Locations such as St Helena Island and Prices Anchorage provide anchorages for daytrippers and weekenders. Scuba diving and free diving are increasing uses of the MBMP in the eastern Bay and on the reef structures off Moreton and Stradbroke islands, especially Flinders Reef and Flat Rock. It is conceivable that the future use of MNP zones by non-extractive users will be enhanced by their no-take status, and hence their improved habitat protection and fish abundance. Scuba diving is a good example where an expected increase in fish abundance and size following no-take zoning will enhance the user experience (15, 16, 26).
The typical on-water user of MBMP was one or two people in a small vessel (≤5m) fishing at one of their preferred locations. Statewide recreational fishing surveys by the Queensland Department of Agriculture and Fisheries also found small vessels (4–5m) to be the most common size owned (43). At locations outside the Bay, the typical users were two to four people in a 5–8-m vessel fishing at a preferred location that was more adventurous to access, but still on a daytrip basis. Most overnight stays on Moreton Bay are made at anchorages within the Bay in vessels within the 8–15-m size range which feature cooking facilities and sleeping accommodation. Thus, the largest vessels operated in the marine park do not travel the greatest distances. Historical anecdotes suggest that this was not always the case. Thirty to forty years ago, large vessels provided the safety and fuel capacity requirements for offshore operation. However, particularly in the last 20 years, innovation in vessel design and the capacity of outboard motor propulsion has much increased the operational capability of mid-size vessels. New design and configuration of 5–8-m vessels (in particular 5–6-m vessels) has brought vessels with high sea-going capacity within scope for users of coastal waters, including recreational fishers.
These vessels have stronger hulls, more freeboard, self-draining decks, much-improved electronics (location, depth sounder and communication equipment), greater fuel capacity (e.g. underfloor) and more reliable outboard motors with improved power-to-weight ratios (pers. obs., 43). These vessels have enabled many recreational fishers to access locations and ocean conditions that would have been unsafe in vessels of this size range in the past. Modern-design vessels have increased the ‘fishing power’ of recreational fishers; fishing power being a concept of an increased ability to catch per vessel that has been well documented in commercial fisheries (44, 45). For example, in Australia’s Northern Prawn Fishery, fishing power (fleet efficiency) is estimated using a range of vessel characteristics – obvious parameters such as horsepower and net configuration, but also parameters such as electronic navigation aids, skipper experience and ease-of-inter- and intra-vessel communication (45, 46). Commercial fishing power or the ability to catch has generally increased over time; and likewise over the decades, improved recreational vessel design and configuration would create a similar increase in ability to catch both by access to new fishing locations and within historical fishing grounds.
Declining catch rates augmented by search and access to new fishing grounds has been documented in south east Queensland as early as the late 1800s and early 1900s (47). From the late 1800s, an offshore recreational snapper fishery was exploited from steam-powered chartered displacement vessels leaving from Brisbane. By the early 1900s, about 10-12 steamboats took groups of fare-paying recreational fishers (~8-50 anglers) offshore from Moreton and Stradbroke Islands. By the 1900s, catch rates in the snapper fishery had declined at close-in reefs and steamboat captains were forced to expand their search range for un-fished grounds. Faster vessels and experienced captains had an advantage to maintain historical catch rates (47). The best technology of the day, these relatively large, crewed charter vessels have little in common with the owner-operated smaller, fast planing hull vessels used by recreational anglers today. But innovation in vessel design and technology continues; allowing recreational fishers to safely access waters once navigable only using large, relatively slow vessels.
During the 1970s/1980s, a typical (~ 5 m) recreational fishing vessel was a fibreglass, outboard-powered planing hull that offered fishers greater access to coastal waters compared with the wooden displacement hulls of the 1950s. It was characterised by:
- Hull configuration with an open bilge that allowed the ingress of water (perhaps with a bilge pump),
- Fuel storage in ~20 l industry-standard containers loosely positioned in the stern of the vessel,
- Relatively low freeboard, stern partially low-cut to fit the outboard motor (perhaps with an ‘outboard well’),
- A forward, seated helm position that was not optimal in poor sea conditions,
- (Electronic) navigation/communication equipment limited to a marine compass and a radio; supplemented by distress signalling equipment.
However, since the initial development of the planing hull, major improvements to vessel configuration and equipment, and hence access to coastal waters has continued. By the 2010s, a typical (~5 m) recreational fishing vessel was characterised by:
- Hull configuration incorporating a sealed self-draining deck and underfloor bilge pump, perhaps with underfloor flotation buoyancy,
- An underfloor fuel tank (≥100 l) built into the structure of the vessel,
- High freeboard with broad gunwales continuous around the stern, outboard motor stern-mounted on an external pod or hull extension,
- A midships (or slightly astern) standing helm position that facilitates optimal operation of the vessel in poor sea conditions,
- Electronic navigation/communication equipment featuring satellite-assisted location fixing; an electronic map-display featuring the vessel’s position; a depth sounder; a marine radio (possibly two) and mobile phone; an emergency position indicating radio beacon (EPIRB); as well as the marine compass and distress signalling equipment.
Recreational vessel configuration and use of electronic technology should be documented in the same manner as has occurred for some fleets of commercial vessels to estimate recreational ‘fishing power’. Improved access to fishing grounds by a large proportion of the public must be considered when evaluating the spatial distribution and extraction pressure of historical fishing effort in respect to stock sustainability (47). However, the effect of increased access would be moderated by output-controls on fishing take, such as bag and size limits.
In Moreton Bay in 2004–06, Leon and Warnken (48) surveyed vessels at anchor from the air to estimate pollutant loads entering the Bay. They photographed vessels in popular anchorages and later analysed the photographs by standardised hull shape and estimated size. A secondary output from their data provided an estimate of patterns of vessel characteristics and vessel-based use of Moreton Bay in relation to day of the week (available leisure time) and weather conditions. Like the current study, they found greater use of Moreton Bay on weekends and when weather conditions were favourable for small vessel operation.
The daily and seasonal patterns of use that we observed match the observations of Leon and Warnken (48). From 2008–2011, vessel use was greater on the weekends than weekdays. On weekdays, the majority of potential boaters were likely engaged in paid work. Matching our observations, the researchers also found a spike in use on days associated with long weekends or over Easter or Christmas holidays. Clearly, access to leisure time and extended leisure time during national holiday periods influences boating activity (similar to the ‘leisure time availability index’ in (48)). In contrast to Leon and Warnken (48), we found that the influence of weather was confined to wind strength.
Vessel operation and safety can be compromised in strong winds (>25 knots) and uncomfortable at medium to strong wind speeds (~15–25 knots). We found fewer vessels were observed on the Bay when the wind was strong (>15 knots) and seas were rougher. During Leon and Warnken’s (48) study, wind alone was not a significant variable predicting vessel use. But their ‘boating conditions forecast index’ (a combination of predicted rainfall, wind speed and BOM weather warnings) was significant and negatively correlated with vessel numbers on Moreton Bay. Overall, they found that the availability of leisure time to vessel operators in the Moreton Bay Region to take their vessel out on MBMP was the strongest factor affecting vessel use.
Leon and Warnken (48) observed vessels in similar categories to our ‘lifestyle vessels’ and yachts as their ‘large fast’ and ‘large slow’ vessels. They found these vessels were common at anchorages on the western sides of Moreton Island and North and South Stradbroke islands. We did not survey as many anchorages as they did, but those that we did survey had a similar array of vessel types. Interestingly, Leon and Warnken (48) observed a larger proportion of vessels > 6m in their surveys than we did, but that was likely because we surveyed vessels both in and beyond anchorages. Leon and Warnken (48) observed vessels in popular anchorages only, and large vessels with onboard accommodation for an overnight stay strongly align with this particular use. Their surveys were done in the early morning or evening, likely before or after vessel operators had completed their day activities and were intent on accessing a safe anchorage for the night. Trailer-able vessels without overnight accommodation would have returned to their launch point by late afternoon or be at fishing locations early morning. Our surveys were conducted over about eight hours of each survey day when vessels were active away from anchorages or launch points.
An interesting contrast in the size of vessels using similar MNP zones is between the Flinders Reef and Flat Rock MNPs; both reef habitats are close and north of a major sand island forming the eastern boundary of Moreton Bay (Moreton and North Stradbroke islands, respectively). While 5–8-m vessels comprise a major proportion of the vessel observations at both reef MNPs, few large vessels > 10m were encountered at Flat Rock, while they were common in the vicinity of Flinders Reef. This was because large cabin vessels trolling for game fish and overnight commercial dive vessels (weekend trips) operate in the waters north of Moreton Island. North of North Stradbroke Island, trolling for game fish was less common and the dive vessels that accessed Flat Rock were often rigid inflatable vessels or daytrip dive vessels that originate from Point Lookout or Manly Harbour.
Leon and Warnken (48) used a size cut-off of 6m for their two size categories of vessels. The > 6m size category served their aim of determining vessels that likely would have anti-fouled hulls and toilet compartments and thus contribute pollutants to the Bay. We used a 5m size cut-off to describe small vs larger vessels, as many modern-designed runabouts in the 5–6m range are designed and built to innovative standards that provide much-enhanced safety capacity and voyage range. These purpose-built 5–6m ‘offshore’ vessels were popular for diving or fishing activity outside Moreton Bay and were common in these offshore waters as a centre-console or walk-around cabin configuration. Vessels < 5m were much less common offshore; this vessel type was often older style vessels or dinghies which are less safe and less capable of the voyage to access offshore waters.
Together with the communication of benefits to non-extractive users of no-take zones, public attitudes seem to support and appreciate including a significant percentage by area of no-take areas in the design of a marine park (19, 28, 49, 50, 51). Support for MPAs is strong despite what appeared to be a consistent media bias in favour of presenting views opposing MPAs (52). Internationally, a large majority of the general population values biodiversity and cultural benefits and favour significant levels of protection of marine habitats via management that limits extraction or other uses (30, 49, 51). Nationally, the public favour significant levels of protection for iconic marine areas such as the Great Barrier Reef (17, 19); as demonstrated through multiple-user support for ~30% bio-representative no-take zoning. In large part, broad public support was gained via comprehensive planning, consultation and implementation of the new management plan (19). Importantly, including high-value habitats within no-take management zones (such as those that previously sustained high rates of extraction), may greatly enhance biodiversity objectives (53, 54), while also enhancing the experience of non-extractive users such as scuba divers (12, 16, 26). Moreover, increasing evidence suggests that extractive users, such as commercial fishers, may benefit from zoning MPAs as they supply fish stocks to adjacent habitats that can be fished (5). Yet these contentions remain challenged by the commercial fishing sector that spoke out against the rezoning of the MBMP (34), and the displacement of commercial fishing effort has been contentious whenever a zoning plan for MPAs in the Australian Exclusive Economic Zone has been proposed (52).
Increasingly, greater areas of coastal and marine seabed are being included in MPAs (53, 55). After considerable debate about no-take zone boundaries, a series of Commonwealth MPAs were enacted around the Australian coastline on 1 July 2018. The MPAs cover close-shore and offshore habitats, including sections of the continental shelf and pelagic waters, ranging from <5% to about 40% MPA protection over the 38 Integrated Marine and Coastal Regionalisation of Australia provinces (53). Since the original 2012 enactment on the federal marine park legislation, the boundaries of the no-take MPAs have been reviewed and rezoned to allow extractive activity over a greater extent of the Marine Park. One large MPA has been implemented in the Coral Sea, though it is a pelagic ecosystem that is being protected from extractive activity and not a series of coastal habitats like the MBMP. Although the extent of no-take zoning has been increased to 16% in the MBMP, it remains low relative to the GBRMP where 33% of the parks’ area sits within no-take zones (53). However, the extent of no-take zoning is relatively high for a coastal, high-use large embayment so close to a major city. The enactment of the MBMP acts as a useful example for similar regions.
While extractive activity is the most common use of the MBMP, non-extractive use is also a major component. No-take zones enhance the on-water experience and the willingness of non-extractive users to pay (12, 16). In addition, the non-market value to the recreational fishing sector using Moreton Bay has likely increased by $1.3 million per year due to rezoning (8). Adding new artificial reefs and enhancing the then-existing artificial reefs (36) also improved the fishing experience for extractive users. On balance, the increase in no-take zones in the marine park from 0.5 to 16% may benefit the universal use of the MBMP and the local economy. Both extractive users (mostly fishers and aquarium collectors) and non-extractive users (such as scuba divers, whale watchers, yachties and the operators of leisure vessels) have access to locations of high-benefit to each group. However, some sectors such as commercial fishers have lost access to a natural resource, and total income across the commercial fishing sector has declined (34, 35).
Acknowledgements
The work was supported by the Queensland Department of Environment and Resource Management (project number 2008/459). A draft of the text was reviewed by Dr Wayne Rochester, CSIRO, Oceans and Atmosphere, Brisbane.
References
- Hilborn R, Stokes K, Maguire J-J, Smith T, Botsford LW, Mangel M, Orensanz J, Parma A, Rice J, Bell J, Cochrane, KL, Garcia S, Hall SJ, Kirkwood GP, Sainsbury K, Stefansson G, Walters C. 2004. When can marine reserves improve fisheries management? Ocean Coastal Management. 47:197-205
- Lynch TP. 2006. Incorporation of recreational fishing effort into design of marine protected areas. Conservation Biology. 20:1466–1476
- Edgar GJ, Russ GR, Babcock RC. 2007. Marine protected areas. In: Connell SD, Gillanders BM (Eds). Marine Ecology. Oxford University Press, Melbourne. p. 524-565
- Garcia-Charton JA, Perez-Ruzafa A, Marcos C, Claudet J, Badalamenti F, Bennedetti-Cecchi L, Falcon JM, Milazzo M, Schembri PJ, Stobart B, Vandeperre F, Brito A, Chemello R, Dimech M, Domenici P, Guala I, Le Direach L, Mappi E. Planes S. 2008. Effectiveness of European Atlanto-Mediterranean MPAs: Do they accomplish the expected effects on populations, communities and ecosystems? Journal of Nature Conservation. 16:193-221
- McCook LJ, Ayling T, Cappo M, Choat JH, Evans RD, De Freitas DM, Heupel M, Hughes TP, Jones GP, Mapstone B, March H, Mills M, Molloy FJ, Pitcher CR, Pressey RL, Russ GR, Sutton S, Sweatman H, Tobin R, Wachenfield DR, Williamson DH. 2010. Adaptive management of the Great Barrier Reef: A globally significant demonstration of the benefits of networks of marine reserves. Proceedings of the National Academy of Science. 107:18278-18285
- Smallwood CB, Beckley LE. 2012. Spatial distribution and zoning compliance of recreational fishing in Ningaloo Marine Park, north-western Australia. Fisheries Research. 125-126:40-50
- Metcalf SJ, Moyle K, Gaughan DJ. 2010. Qualitative analysis of recreational fisher response and the ecosystem impacts of management strategies in a data-limited situation. Fisheries Research. 106:289-297
- Pascoe S, Doshi A, Dell Q, Tonks M, Kenyon R. 2014. Economic value of recreational fishing in Moreton Bay and the potential impact of the marine park rezoning. Tourism Management. 41:53-63
- Bartholomew A, Bohnsack JA. 2005. A review of catch-and-release angling mortality with implications for no-take reserves. Reviews in Fish Biology and Fisheries. 15:129-154
- Taylor N, Buckenham B. 2003. Social impacts of marine reserves in New Zealand. Science for Conservation. 217: 58p
- Wood LJ, Fish L, Laughren J, Pauly D. 2008. Assessing progress towards global marine protections targets: shortfalls in information and action. Oryx. 42:340- 351
- Farr M, Stoeckl N, Beg RA. 2014. The non-consumptive (tourism) ‘value’ of marine species in the Northern Section of the Great Barrier Reef. Marine Policy. 43:89-103
- Devitt KR, Adams VM, Kyne PM. 2015. Australia’s protected area network fails to adequately protect the world’s most threatened marine fishes. Global Ecology and Conservation. 3:401-411
- Togridou A, Hovardas T, Pantis JD. 2006. Determinants of visitors’ willingness to pay for the National Marine Park of Zakynthos, Greece. Ecological Economics. 60:308-319
- Sorice MG, Oh C-O, Ditton RB. 2007. Managing Scuba Divers to Meet Ecological Goals for Coral Reef Conservation. Ambio. 36:316-322
- Arin T, Kramer AK. 2002. Divers’ willingness to pay to visit marine sanctuaries: an exploratory study. Ocean and Coastal Management. 45:171-183
- Deloitte Access Economics. 2017. At what price? The economic, social and icon value of the Great Barrier Reef. Great Barrier Reef Foundation, Australia
- Hand T. 2003. An economic and social evaluation of implementing the representative areas program by rezoning the Great Barrier Reef Marine Park. Great Barrier Reef Marine Park Authority. Townsville, Australia. http://www.gbrmpa.gov.au/__data/assets/pdf_file/0012/6204/PDP_Report_23-12-03.pdf viewed 16/1/2014.
- Fernandes L, Day J, Lewis A, Slegers S, Kerrigan B, Breen D, Cameron D, Jago B, Hall J, Lowe D, Innes J, Tanzer J, Chadwick V, Thompson L, Gorman K, Simmons M, Barnett B, Sampson K, De’ath G, Mapstone B, Marsh H, Possingham H, Ball I, Ward T, Dobbs K, Aumend J, Slater D, Stapleton K. 2005. Establishing representative no-take areas in the Great Barrier Reef: Large-scale implementation of theory on marine protected areas. Conservation Biology. 19(6):1733-1744
- Cocklin C, Craw M, McAuley I. 1998. Marine reserves in New Zealand: use rights, public attitudes and social impacts. Coastal Management. 26:213-231
- Birtles A, Valentine P, Curnock M, Arnold P, Dunstan A. 2002. Incorporating visitor experiences into ecologically sustainable dwarf minke whale tourism in the northern Great Barrier Reef. CRC Reef Research Centre Technical Report No 42, CRC Reef Research Centre Ltd, Townsville
- Moscardo G, Saltzer R, Galletly A, Burke A, Hildebrandt A. 2003. Changing Patterns of Reef Tourism. CRC Reef Research Centre Technical Report No. 49, CRC Reef Research Centre, Townsville
- Bhat MG. 2003. Application of non-market valuation of the Florida Keys marine reserve management. Journal of Environmental Management. 67:315-325
- Brenner J, Jiménez JA, Sardá R, Garola A. 2010. An assessment of the non-market value of the ecosystem services provided by the Catalan coastal zone, Spain. Ocean and Coastal Management. 53:27-38
- Laurans Y, Pascal N, Binet T, Brander L, Clua E, David G, Rojat D, Seidl A. 2003. Economic valuation of ecosystem services from coral reefs in the South Pacific: Taking stock of recent experience. Journal of Environmental Management. 116:135-144
- Schuhmann PW, Casey JF, Horrocks JA, Oxenford HA. 2013. Recreational scuba divers willingness to pay for marine biodiversity in Barbados. Journal of Environmental Management. 121:29-36
- NSW Marine Park Authority. 2004. Economic values of NSW Marine Parks. Models for identifying economic values, and developing procedures for on-going data collection and monitoring. Hassall and Associates and Gillespie Economics. Final Report AU1-282
- Wallmo K, Kosaka R. 2014. Public preferences for marine protected areas off the U.S. west coast: the significance of restrictions and size on economic value. U.S. Dep. Commerce, NOAA Tech. Memo. NMFS-F/SPO-144
- Costanza R, d’Arge R, de Groot R, Farber S, Grasso M, Hannan B, Limberg K, Neem S, O’Neill RV, Paruelo J, Raskin RG, Sutton P, van bert Belt M. 1997. The value of the world’s ecosystem services and natural capital. Nature. 387:253-260
- Bryce R, Trvine KN, Chruch A, Fish R, Ranger S, Kenter JO. 2016. Subjective well-being indicators for large-scale assessment of cultural ecosystem services. Ecosystem Services. 21:258-269
- Gray DL, Canessa RR, Keller CP, Dearden P, Rollins RB. 2011. Spatial characterisation of marine recreational boating: Exploring the use of an on-the-water questionnaire for a case study in the Pacific Northwest. Marine Pollution. 35:286-298
- Schrobback P, Pascoe S, Coglan L. 2014. Shape Up or Ship Out: Can We Enhance Productivity in Coastal Aquaculture to Compete with Other Uses? PLoS ONE 9(12):e115912. doi:10.1371/journal.pone.0115912
- Queensland. Environmental Protection Agency. 2007. Have your say Moreton Bay Marine Park: draft zoning plan including regulatory impact statement and draft public benefit test. Environmental Protection Agency (QLD). Brisbane
- van der Geer C, Mills M, Adams VM, Pressey RL, McPhee D. 2013. Impacts of Moreton Bay Marine Park rezoning on commercial fisherman. Marine Policy. 39:248-256
- McPhee DP, Mills M, Hundloe TJA, Buxton CD, Knuckey I, Williams KA. 2008. A participatory and coordinated fishing industry solution to the rezoning of the Moreton Bay Marine Park. Final Report 2007/053. Fisheries Research Development Corporation. Canberra, Australia
- Anon. Moreton Bay Marine Park User Guide. 2008. Queensland Government Department of National Parks, Recreation, Sports and Racing. Brisbane, Australia https://www.legislation.qld.gov.au/LEGISLTN/SLS/2008/08SL343.pdf viewed 16/1/2014
- Kenyon R, Babcock R, Dell Q, Lawrence E, Moeseneder C, Tonks M. 2018. Business as usual for the human use of Moreton Bay following marine park zoning. Marine and Freshwater Research. 69:277-289
- Underwood AJ. 1994. On beyond BACI: Sampling designs that might reliably detect environmental disturbances. Ecological Applications. 49(1):3-15
- DERM. 2008. Final public benefit test report for the marine parks (Moreton Bay) zoning plan 2008. Department of Environment and Resource Management. Brisbane, Australia
- McCullagh P, Nelder JA. 1989. Generalised Linear Models (2nd Edition). Chapman and Hall, London
- Venables WN, Ripley BD. 2002. Modern Applied Statistics with S. Fourth Edition. Springer-Verlag
- Clarke KR, Gorley RN. 2006. PRIMER v6: User Manual/Tutorial (Plymouth Routines in Multivariate Ecological Research). PRIMER-E, Plymouth
- Webley J, McInnes K, Teixeira D, Lawson A, Quinn R. 2015. Statewide Recreational Fishing Survey 2013-14. Queensland Department of Agriculture and Fisheries. Brisbane
- O’Neill MF, Leigh GM. 2007. Fishing power increases in Queensland’s east coast trawl fishery, Australia. Fisheries research. 85:84-92
- Bishop J, Venables WN, Dichmont CM, Sterling DJ. 2008. Standardising catch rates: is logbook information by itself enough? ICES Journal of Marine Science. 65:255-266
- Bishop J, Venables WN, Wang Y-G. 2004. Analysing commercial catch and effort data from a Penaeid trawl fishery: A comparison of linear models, mixed models and generalised estimating equations approaches. Fisheries Research. 70:179-193
- Thurstan RH, Campbell AB, Pandolfi JM. 2016. Nineteenth century narratives reveal historic catch rates for Australian snapper (Pagrus auratus). Fish and Fisheries. 17:210-225.
- Leon LM, Warnken J. 2008. Copper and sewage inputs from recreational vessels at popular anchor sites in a semi-enclosed Bay (Qld, Australia): Estimates of potential annual loads. Marine Pollution Bulletin. 57:838-845
- Börger T, Hattam C, Burdon D, Atkins JP, Austen MC. 2014. Valuing conservation benefits of an offshore marine protected area. Ecological Economics. 108:229-241
- Wallmo K, Lew D. 2011. Valuing improvements to threatened and endangered marine species: an application of stated preference choice experiments. Journal of Environmental Management. 92(7):1793-1801
- Brouwer R, Brouwer S, Eleveld MA, Verbraak M, Wagtendonk AJ, vanderWoerd HJ. 2016. Public willingness to pay for alternative management regimes of remote marine protected areas in the North Sea. Marine Policy. 68:195-204
- Compas E, Clarke B, Cutlerand C, Daish K. 2007. Murky waters: Media reporting of marine protected areas in South Australia. Marine Policy. 31:691–697
- Devillers R, Pressey RL, Grech A, Kittinger JN, Edgar GJ, Ward T, Watson R. 2015. Reinventing residual reserves in the sea: are we favouring ease of establishment over need for protection? Aquatic Conservation: Marine Freshwater Ecosystems. 25:480-504. DOI: 10.1002/aqc.2445
- Lynch TP, Wilkinson EA, Melling L, Hamilton R, Macready A, Feary S. 2004. Conflict and impacts of divers and anglers in a Marine Park. Environmental Management. 33:196-211
- Larcombe J, Marton N. 2016. Potential displacement of commercial fisheries by a Commonwealth marine reserve zoning scheme: Report on Panel-recommended network. ABARES technical report to client prepared for the Department of the Environment. Canberra