-
Previous paper
The impact of marine pollutants and marine debris in Moreton Bay
Kathy A. Townsend1,2, Christine Baduel3, Vicki Hall4, Jennifer Loder5, Veronica Matthews6, Jochen Mueller3, Rachael Nasplezes7, Qamar Schuyler8, Heidi Taylor9, Jason van de Merwe10, C. Aleander Villa3 and Liesbeth Weijs3, 10 -
This paper
Projected changes to population, climate, sea-level and ecosystems
Megan I. Saunders1,2, Rebecca Runting3, Elin Charles-Edwards2, Jozef Syktus4 and Javier Leon5 -
Next paper
Primary producers in Moreton Bay: Phytoplankton, benthic microalgae and filamentous cyanobacteria
Saeck, Emily1,2, Grinham, Alistair3, Coates Marnane, Jack1, McAlister, Tony4, Burford, Michele*1
Projected changes to population, climate, sea-level and ecosystems
Authors
Megan I. Saunders1,2, Rebecca Runting3, Elin Charles-Edwards2, Jozef Syktus4 and Javier Leon5Author affiliations
- School of Chemical Engineering, University of Queensland, St Lucia, Qld 4067; present CSIRO Oceans and Atmosphere, Queensland Bioscience Precinct, St Lucia, Qld 4067 Australia;
- School of Earth and Environmental Sciences, The University of Queensland, St. Lucia Qld, 4074, Australia;
- School of Geography, The University of Melbourne, Melbourne, 3010, Australia;
- Global Change Institute, The University of Queensland, St. Lucia Qld, 4074, Australia;
- Faculty of Science, Health, Education and Engineering, The University of the Sunshine Coast, Sippy Downs Qld, 4556, Australia.
Corresponding author
[email protected]ORCID
Megan Saunders: https://orcid.org/0000-0002-8549-5609
Rebecca Runting: https://orcid.org/0000-0003-0614-1456
Elin Charles-Edwards: https://orcid.org/0000-0003-2580-207X
Jozef Syktus: https://orcid.org/0000-0003-1782-3073
Javier Leon: https://orcid.org/0000-0002-4201-5804
Book
Projected changes to population, climate, sea-level and ecosystems
Chapter
Research Paper Title
Projected changes to population, climate, sea-level and ecosystems
Cite this paper as:
Saunders M, Runting R, Charles-Edwards E, Syktus J, Leon J. 2019. Projected changes to population, climate, sea-level and ecosystems. In Tibbetts, I.R., Rothlisberg, P.C., Neil, D.T., Homburg, T.A., Brewer, D.T., & Arthington, A.H. (Editors). Moreton Bay Quandamooka & Catchment: Past, present, and future. The Moreton Bay Foundation. Brisbane, Australia. Available from: https://moretonbayfoundation.org/
DOI
10.6084/m9.figshare.8073791
ISBN
978-0-6486690-0-5
Abstract
By 2050 Moreton Bay region will be impacted by significant changes in environment and population size and distribution. The human population of the Moreton Bay catchment is expected to increase from 3.2 million in 2015 to 4.8 million in 2036, with migration the likely primary driver of this growth. Mean annual air temperature is expected to rise between 1.2 and 1.7ºC relative to 1986-2005 values by 2050 depending on the emissions scenario. Mean annual rainfall will likely decrease by 4–7% over the same period, depending on the emissions scenario, although significant multi-model variability in this estimate means changes of +13% to –23% are possible. Rainfall in summer will change little, whereas rainfall in winter, spring and autumn will likely decrease. Sea level will likely rise 0.21–0.27 m by 2050 relative to 1986–2005, and will impact coastal marine ecosystems. Seagrass area is expected to decline by 6% relative to year 2000 values and saltmarsh by up to 13% relative to year 2013 values by 2050. Mangrove habitats could potentially almost double their current extent, if they are able to establish in presently dryland areas.
Keywords: population, climate change, temperature, precipitation, sea-level rise, seagrass, mangrove, saltmarsh
Overview
Substantial changes in climate and population are expected to occur in the Moreton Bay region by 2050. This will affect people and natural ecosystems in the region. This paper examines how human population, climate, sea level and the distribution of coastal ecosystems may change by 2050. Projections are not available for 2050 for some variables; in this instance, the projections for the latest year that are available are presented. Estimates of future human population in the region have been made by analysing historic trends in population and projecting to 2036. Population data are based on Statistical Areas Level 2 (SA2) in 2011 and Geosciences Australia’s Australia’s River Basins 1997 (93rd edition 2004) (1) for the catchments of Brisbane River, Logan-Albert Rivers, Maroochy River, Pine River, South Coast and Stradbroke Island. Projections of changes in climate, including temperature and rainfall, have been derived from climate projections developed to support the Fifth Assessment Report of the Intergovernmental Panel on Climate Change (IPCC) released in 2013. Estimates of sea-level rise rates have been obtained from regional projections, which closely follow IPCC projections based on Representative Concentration Pathways (RCPs). Projections of the redistribution of coastal ecosystems, including saltmarsh, mangrove and seagrass meadows, have been made using the Sea-Level Affecting Marshes Model (SLAMM) and a seagrass distribution model parameterised for Moreton Bay. The projected redistribution of coastal ecosystems is presented for subset areas of Moreton Bay under a number of different sea-level rise scenarios. These estimates do not include changes in the distribution of coastal ecosystems resulting from changes in precipitation or temperature, nor from changes in land-use policies such as clearing and development.
We acknowledge that other environmental changes will also influence the system (e.g. ocean acidification) as will other human developments (e.g. the potential expansion of the blue economy and marine industries in the region). However, as reliable projections of these changes and the influences on the area do not yet exist, we have chosen to omit them here and focus on those changes that have been most fully assessed to date.
Population
The Moreton Bay catchment sits within south east Queensland, which is one of the most populated and rapidly growing areas in Australia, home to around 3.2 million people in 2015 (Table 1) or close to 15 % of the total population of Australia. There are six sub-catchments draining into Moreton Bay – The Brisbane, Logan-Albert, Maroochy, and Pine Rivers, South Coast, and Stradbroke. Four sub-catchments drain entirely into the Bay, whereas, the Maroochy and South Coast catchments drain only in part into Moreton Bay. The majority of the population of Southeast Queensland is located in the Brisbane catchment (1.2 million), followed by the Pine River (0.7 million) and the South Coast (0.6 million) catchments. The Stradbroke catchment is the least populated, with a population of just 9,500 in 2015. Since 1991, the Moreton Bay catchment population has grown by more than a million people, an annualised growth rate of 2.3%. This is much higher than the 1.3% per annum Australia-wide over the same period. High levels of growth are projected to continue over the next two decades, with the population of Southeast Queensland catchments expected to reach 4.8 million by 2036 (2). The majority of this growth to 2036 is projected to occur in the Brisbane River sub-catchment.
Table 1. Observed and predicted population of the Moreton Bay catchment and its sub-catchments, 1971–2036. (Source: Australian Bureau of Statistics unpublished data and Queensland Government Statistician’s Office unpublished data)
| Catchment | 1991 | 1996–2015
(% per year) |
2015 | 2015–2036 (%) | 2036 |
| Brisbane River | 744,923 | 1.9 | 1,166,838 | 1.9 | 1,730,739 |
| Logan-Albert River | 314,251 | 2.3 | 538,404 | 1.8 | 790,718 |
| Maroochy River | 145,259 | 3.2 | 310,461 | 2.1 | 480,045 |
| Pine River | 393,370 | 2.2 | 662,343 | 1.4 | 886,466 |
| South Coast | 257,841 | 3.2 | 550724 | 2.1 | 857,317 |
| Stradbroke | 4,078 | 3.6 | 9,472 | 1.4 | 12,644 |
| Moreton Bay | 1,859,722 | 2.3 | 3,238,242 | 1.8 | 4,757,929 |
| Queensland | 2,960,951 | 2.0 | 4,778,854 | 1.7 | 6,763,153 |
Note: the Moreton Bay catchment is defined here as the sum of the sub-catchments listed above.
The growth between 1991 and 2015 has not been distributed uniformly across the catchment area (Fig. 1). The most dramatic population growth occurred on the peri-urban fringe of the Brisbane metropolitan area, the northern Gold Coast and hinterland, Caboolture and the Sunshine Coast. The pattern of growth is a product of urban extensification, with greenfield development transforming agricultural land and other land types for urban development. The growth in Brisbane’s urban core is the exception, and reflects a process of urban consolidation, much of which is occurring within a couple of kilometres of the Brisbane River.

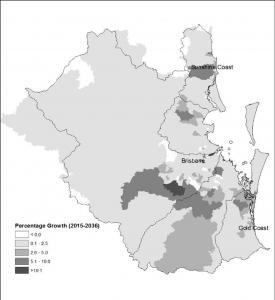
Figure 1. Population growth, Moreton Bay Catchment 1991–2015 and 2015–36 (Source: Australian Bureau of Statistics unpublished data and Queensland Government Statistician’s Office unpublished data).Natural increase (births – deaths) increased between 2001 and 2008 but has been relatively stable since 2009, contributing around 21,000 people per annum (Fig. 2). Net migration, both internal and international, has been much more variable, ranging from 27,000 to 57,000 people per annum. Migration accounted for more than three-quarters of the growth at the start of the period and was primarily comprised of moves from other parts of Australia. In recent years, the contribution of migration to overall growth has declined, accounting for just over half of the annual growth in 2014. There is some evidence that the composition of migrants has changed, with international migrants making up an increasing share. Migration is expected to continue to an important driver of population growth in the Moreton Catchment to 2036.

Climate
The South East Queensland region has a subtropical climate, with warm to hot weather for most of the year. The average annual surface temperature (1986–2005) in the South East Queensland region was 19oC. The rainfall in the region has strong inter-annual variability influenced by El Niño–Southern Oscillation (3). The average (1986–2005) annual total rainfall over the region was 996mm.

Climate-change projections to 2050 are presented for two RCPs. The high emissions future (RCP8.5) assumes no curbing of greenhouse gas emissions, where a carbon dioxide (CO2) concentration reaches 940ppm by 2100. A lower emissions future (RCP4.5) assumes emissions peak around 2040, with CO2 concentrations at 540ppm by 2100. While the Paris Agreement aspires to substantially reduce global emissions to limit global warming to below 2oC by 2100, the global greenhouse gas emissions currently track close to the RCP8.5 pathway, so RCP4.5 is a more realistic lower emission scenario. Climate projection information presented herein is based on data from the CSIRO and Bureau of Meteorology Climate Change in Australia (4). Figure 3 shows the patterns of projected changes in mean annual temperature and rainfall in Queensland at 2050 for two emission scenarios (5).
Projected temperature changes
Climate change projections show that by 2050, the median annual temperature is likely to increase by 1.2oC under RCP4.5 and 1.7oC under RCP8.5 relative to the 1986–2005 base period. The projected range of annual temperature change derived from multi-model projections is 0.9oC to 1.6oC for lower emissions and 1.2oC to 2.1oC for high emissions. Projected changes at seasonal scales are qualitatively similar to the projected changes in annual temperature.
Projected precipitation changes
Projections show that by 2050, the mean total annual rainfall is likely to decrease by 4% under RCP4.5 and 7% under RCP8.5. However, projections show a large range of changes simulated by multi-model ensemble ranging from an annual increase of 13% to a decrease of 23%. Projections show little change in median rainfall during the summer season, but a significant rainfall decrease is projected for median rainfall during the winter, spring and autumn. The median rainfall decrease is around 6% for lower emissions and 6–15% under high emissions, with winter season rainfall projected to decrease the most (Table 2).
Table 2: Projected changes in seasonal rainfall in South East Queensland region at 2050 for lower (RCP4.5) and high (RCP8.5) emission scenarios. Projected changes are shown for median and range (5th and 95th percentile) of model projections. Projections are shown as % change from the 1986-2005 period. Source: https://www.qld.gov.au/environment/climate/climate-change/resources/science.
| Annual | Summer | Autumn | Winter | Spring | |
| RCP4.5 | -5 (-15 to 9) |
-1 (-21 to 23) |
-6 (-26 to 29) |
-6 (-26 to 8) |
-5 (-27 to 19) |
| RCP8.5 | -7 (-23 to 13) |
0 (-27 to 21) |
-6 (-28 to 29) |
-15 (-33 to 9) |
-9 (-32 to 15) |
Sea-level change
Global mean sea level is driven by changes in water temperature (i.e. thermal expansion/contraction) and ocean mass (e.g. contributions from melting ice caps). Regional changes in sea level are additionally influenced by ocean dynamics and land motion. Around Australia, tide-gauge records show an average trend of relative sea-level rise of around 2.1mm yr-1 for the period 1966–2009, which is closely correlated to the global-mean trends. A slightly lower trend of 1.8mm yr-1 was recorded at Mackay tidal-gauges, the closest station to Moreton Bay (6).
Regional sea-level rise projections for the Australian coastline are very similar to the global RCPs projections for 2050 (7). As for the global levels, the projected rises under the different RCP scenarios diverge considerably after 2050. Based on projections from nearby sites (Newcastle and Mackay), sea-level in South East Queensland will rise between 0.21–0.27m for 2050 relative to 1986–2005. Under RCP2.6 the predicted rise is around 0.21, and under RCP8.5 the rise is at the upper end of the range. By 2090, trends in sea-level rise are expected to accelerate and reach values between 0.43–0.86m relative to 1986–2005 (with the lower end of the range likely under RCP2.6, and the higher values the more likely outcome under RCP8.5) (8).
Rapidly increasing sea levels will combine with astronomical tides, storm surges and waves, particularly from tropical cyclones and east coast lows, resulting in accelerated coastal erosion and increased inundation of some low-lying areas. In South East Queensland, rates of coastal erosion can be expected to increase with storm tides and changes in sediment transport along exposed sandy shorelines, such as those on the Gold Coast, Sunshine Coast, and Stradbroke and Moreton islands. Low-lying, sheltered areas such as sectors of the coastline along Moreton Bay can expect higher frequencies of both temporary and permanent coastal inundation.
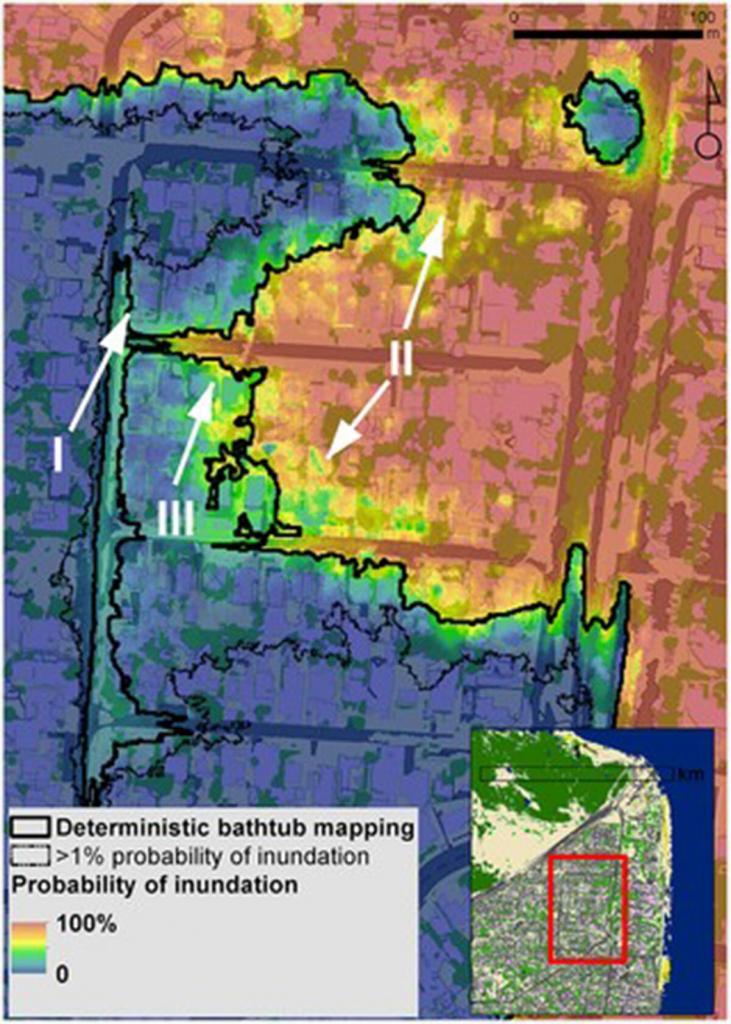
Assessing the impacts of projected sea-level rise on ecosystems or infrastructure is very challenging given the uncertainties inherent in sea-level projections, particularly at the regional and local scales, and the complex interactions with atmospheric forcing and uncertainties in spatial data. Recently, case studies along Moreton Bay and the Sunshine Coast have implemented probabilistic approaches that explicitly incorporate such uncertainties when assessing coastal vulnerability (9, 10) and modelling impacts to ecosystems (9). This approach can be used in a risk-averse decision-making process by planning for scenarios with different probabilities and providing visually intuitive maps that convey uncertainties inherent in spatial data and analysis (Fig. 4).
For a subset of the Moreton Bay coastline, probability of inundation at each location was calculated for 1m SLR during a 100 average recurrence interval (ARI) storm surge event, with the probability of inundation indicated by the colour gradient (Fig. 4). Our expectation of whether a property will be inundated varies depending on whether a bathtub model or a probabilistic model is used to quantify inundation risk. Areas with a probability of inundation greater than 1% are indicated by the thin solid line, and areas indicated as inundated by a bathtub model are shown by the thick black line. Examples of low-lying areas (zone I) and houses surrounded by vegetation (zone II) are mapped as inundated based on the deterministic bathtub map (wide solid black line) but appear as uncertain areas with lower probability (30%) of becoming inundated based on the probabilistic mapping. Conversely, areas with a complex terrain (zone III) that appear safe from inundation based on the deterministic mapping can have a large probability (60–90%) of getting inundated (from Leon et al. (10)).
Ecosystems
Research examining the potential future distribution and abundance of wetlands in Moreton Bay, including seagrass, mangroves and saltmarsh, has focused on the impacts of sea-level rise on those habitats. Warming temperatures, ocean acidification, and changes in precipitation will also affect marine wetlands, but to date have not been assessed in detail for the region. Taxa other than habitat-forming species will also be affected by environmental and human driven change in the region; however, projections are not readily available for these other species so we focus on the habitats to give a sense of the scale of the issue.
Rising seas cause a redistribution of the plants and animals that live near sea level. This is because deepening water causes changes in the distribution of environmental conditions influencing the distribution and extent of suitable habitat for coastal marine species. Coastal marine habitat forming species can respond to rising seas by (i) moving shorewards; (ii) building the seafloor upwards by trapping sediments and biological materials (vertical accretion); (iii) adapting to new environmental conditions, such as diminished light or longer periods of immersion; or (iv) ceasing to occupy areas that are no longer suitable. The combination of these responses results in altered (increased or decreased) distribution and abundance.
Mangroves and saltmarsh are terrestrial plants that can tolerate periodic immersion in seawater. Therefore, rising seas cause increased immersion at the deep edge of the habitat extent, and encroachment into terrestrial habitats at the landward edge because of inundation.
Seagrass and corals are marine organisms that live in shallow coastal water due to high light requirements. Increased water level reduces the light intensity at the seafloor, but increases the accommodation space for growth at the shallow edge. Seagrass habitats across Moreton Bay are expected to decline by ~6% by 2050 as a consequence of sea-level rise due to (i) reduced light intensity at the deep edge, and (ii) limited opportunity to expand shoreward (11). Losses are expected to increase to about ~15% by 2100 as sea-level rise accelerates (11), but these could be minimized by policies aimed at coastal retreat, which help ecosystems migrate inland unimpeded by sea-walls, levees or other infrastructure (11). Larger relative impacts are expected in the western Bay where water clarity is murkier and the seagrass depth range is contracted compared to the eastern Bay. Policies aimed at improving water clarity could help seagrass adapt to rising seas (11).
Impacts on mangroves and saltmarsh have been assessed for two areas within Moreton Bay; specifically, the southern Bay islands (12–14) and the Moreton Bay Regional Council area (9). Mangrove habitat is expected to expand with sea-level rise, but this comes at the expense of salt marsh and previously dryland areas, which are expected to contract (Fig. 5, Table 3). However, this expansion is only possible if land currently used for agriculture is allowed to transition to wetlands, and there is no further urban development in the region. Given the projections for population growth in the Moreton Bay region, urban development is likely to continue and reduce the area available for coastal wetland migration. This is concerning, as the majority of the coastal wetland expansion is projected to occur outside the current reserve network. This highlights the importance of expanding the reserve network (or rezoning land) to accommodate the potential landward movement of coastal wetlands subject to sea-level rise.
Historic changes in sea level have impacted coral reefs in Moreton Bay in the past (15) as have human activities such as land-clearing causing increased sedimentation and turbidity. It is unclear how corals will respond to future sea-level change as future impacts of sea-level rise (and other drivers) on coral reefs in Moreton Bay have not been assessed. In general, increasing water level over reefs that are currently constrained by water level increases accommodation space, allowing corals to resume upwards growth (e.g. Saunders et al. (16)). However, the increasing temperatures in the Bay have implications for exposure to temperatures that could cause bleaching. In combination with the effects of ocean acidification on the capacity for calcification and growth (17), the future for corals becomes more uncertain.
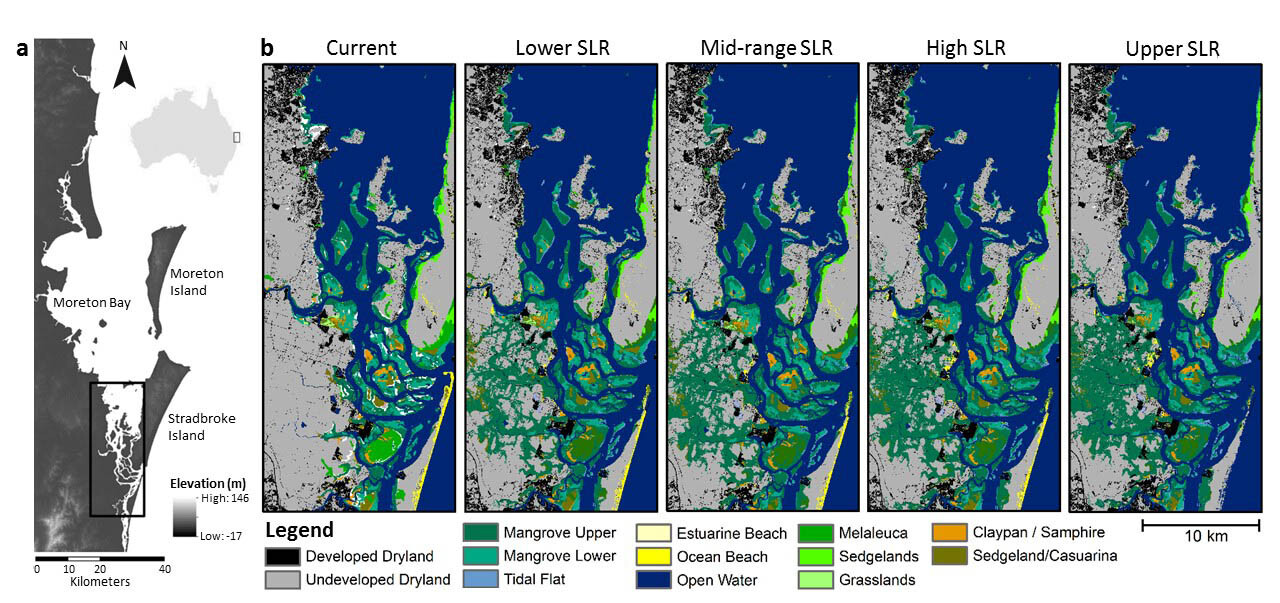
Table 3. Total area of mangroves and salt marsh protected and unprotected based on different projections of sea-level rise by 2050 (low=10.3cm, mid =20.2cm, high=36cm, upper=47cm). All values are in hectares and calculated based on modelling reported in Runting et al. (13).
| Current | Low | Mid | High | Upper | ||
| Mangroves | Protected | 1,015 | 1,492 (+47%) | 1,595 (+57%) | 1,787 (+76%) | 1,856 (+83%) |
| Unprotected | 6,193 | 10,235 (+65%) | 10,922 (+76%) | 11,944 (+93%) | 11,860 (+92%) | |
| Total | 7,208 | 11,727 (+63%) | 12,517 (+74%) | 13,731 (+90%) | 13,716 (+90%) | |
| Salt marsh | Protected | 493 | 481 (-2.4%) | 461 (-6.5%) | 428 (-13%) | 371 (-25%) |
| Unprotected | 1,158 | 1,480 (+28%) | 1,408 (+22%) | 1,245 (+7.5%) | 1,092 (-5.7%) | |
| Total | 1,651 | 1,961 (+19%) | 1,869 (+13%) | 1,673 (+1.3%) | 1,463 (-11%) |
Conclusions
The Moreton Bay region is likely to see significant population growth and climatic changes in the coming decades. By 2050, under the high RCP8.5 emission scenario, mean annual air temperature could be 1.7ºC higher, rainfall could decrease by 7%, and sea levels could be up to 27cm higher. The human population is likely to increase by 1.8% yr-1 over the coming decades, leading to an overall population increase to 4.8 million by 2036 These changes will undoubtedly affect both human and natural systems, as we have illustrated here, with substantial shifts in the distribution of coastal ecosystems in the region by 2050. These impacts should be considered conservative projections, and the cumulative impacts of growing human populations and the full range of climate change phenomena could lead to more extreme changes throughout the Moreton Bay region.
References
- Geosciences Australia. 2004. Australia’s river basins 1997. 93rd ed. Australian Government, Canberra, Australia
- QGSO. 2015. Queensland government population projections. 2015 ed. Queensland Treasury, Brisbane, Australia
- Klingaman NP, Woolnough SJ, Syktus J. 2013. On the drivers of inter‐annual and decadal rainfall variability in Queensland, Australia. International Journal of Climatology. 33(10):2413-2430. http://dx.doi.org/10.1002/joc.3593
- CSIRO, Bureau of Meteorology. 2015. Climate change in Australia information for Australia’s natural resource management regions: Technical report. Australia. https://www.climatechangeinaustralia.gov.au/en/publications-library/
- DEHP. 2017. Climate change in Queensland map application. [Accessed: 20 June 2018]. Available from: https://www.Qld.gov.au/environment/climate/resources
- White NJ, Haigh ID, Church JA, Koen T, Watson CS, Pritchard TR, Watson PJ, Burgette RJ, McInnes KL, You Z-J, Zhang X, Tregoning P. 2014. Australian sea levels—trends, regional variability and influencing factors. Earth-Science Reviews. 136:155-174. http://dx.doi.org/10.1016/j.earscirev.2014.05.011
- Church JA, Clark PU, Cazenave A, Gregory JM, Jevrejeva S, Levermann A, Merrifield MA, Milne GA, Nerem RS, Nunn PD, Payne AJ, Pfeffer WT, Stammer D, Unnikrishnan AS. 2013. Sea level change. In: Stocker TF, Qin D, Plattner G-K, Tignor M, Allen SK, Boschung J, Nauels A, Xia Y, Bex V, Midgley PM, (Eds). Climate Change 2013: The Physical Science Basis Contribution of Working Group I to the Fifth Assessment Report of the Intergovernmental Panel on Climate Change. Cambridge University Press. Cambridge, United Kingdom and New York, NY, USA
- McInnes KL, Church J, Monselesan D, Hunter J, O’Grady J, Haigh I, Zhang X. 2015. Information for Australian impact and adaptation planning in response to sea-level rise. Australian Meteorological and Oceanographic Journal. 65(1): 127-149
- Mills M, Leon JX, Saunders MI, Bell J, Liu Y, O’Mara J, Lovelock CE, Mumby PJ, Phinn S, Possingham HP, Tulloch V, Mutafoglu K, Morrison T, Callaghan D, Baldock T, Klein CJ, Hoegh-Guldberg O. 2016. Reconciling development and conservation under coastal squeeze from rising sea-level. Conservation Letters. 9(5): 361-368
- Leon JX, Heuvelink GBM, Phinn SR. 2014. Incorporating DEM uncertainty in coastal inundation mapping. Plos One. 9(9):e108727. http://dx.doi.org/10.1371/journal.pone.0108727
- Saunders MI, Leon J, Phinn SR, Callaghan DP, O’Brien KR, Roelfsema CM, Lovelock CE, Lyons MB, Mumby PJ. 2013. Coastal retreat and improved water quality mitigate losses of seagrass from sea level rise. Global Change Biology. 19(8):2569-2583. http://dx.doi.org/10.1111/gcb.12218
- Traill LW, Perhans K, Lovelock CE, Prohaska A, McFallan S, Rhodes JR, Wilson KA. 2011. Managing for change: Wetland transitions under sea level rise and outcomes for threatened species. Diversity and Distributions. 17(6):1225–1233
- Runting RK, Lovelock CE, Beyer HL, Rhodes JR. 2017. Costs and opportunities for preserving coastal wetlands under sea level rise. Conservation Letters. 10(1):49-57. http://dx.doi.org/10.1111/conl.12239
- Runting RK, Wilson KA, Rhodes JR. 2013. Does more mean less? The value of information for conservation planning under sea level rise. Global Change Biology. 19(2):352-363. http://dx.doi.org/10.1111/gcb.12064
- Lybolt M, Neil D, Zhao J, Feng Y, Yu K-F, Pandolfi J. 2011. Instability in a marginal coral reef: The shift from natural variability to a human-dominated seascape. Frontiers in Ecology and the Environment. 9(3):154-160. http://dx.doi.org/10.1890/090176
- Saunders MI, Albert S, Roelfsema CM, Leon JX, Woodroffe CD, Phinn SR, Mumby PJ. 2016. Tectonic subsidence provides insight into possible coral reef futures under rapid sea-level rise. Coral Reefs. 35:155–167. http://dx.doi.org/10.1007/s00338-015-1365-0
- Chan NCS, Connolly SR. 2013. Sensitivity of coral calcification to ocean acidification: A meta‐analysis. Global Change Biology. 19(1):282-290. http://dx.doi.org/10.1111/gcb.12011